Science Highlights
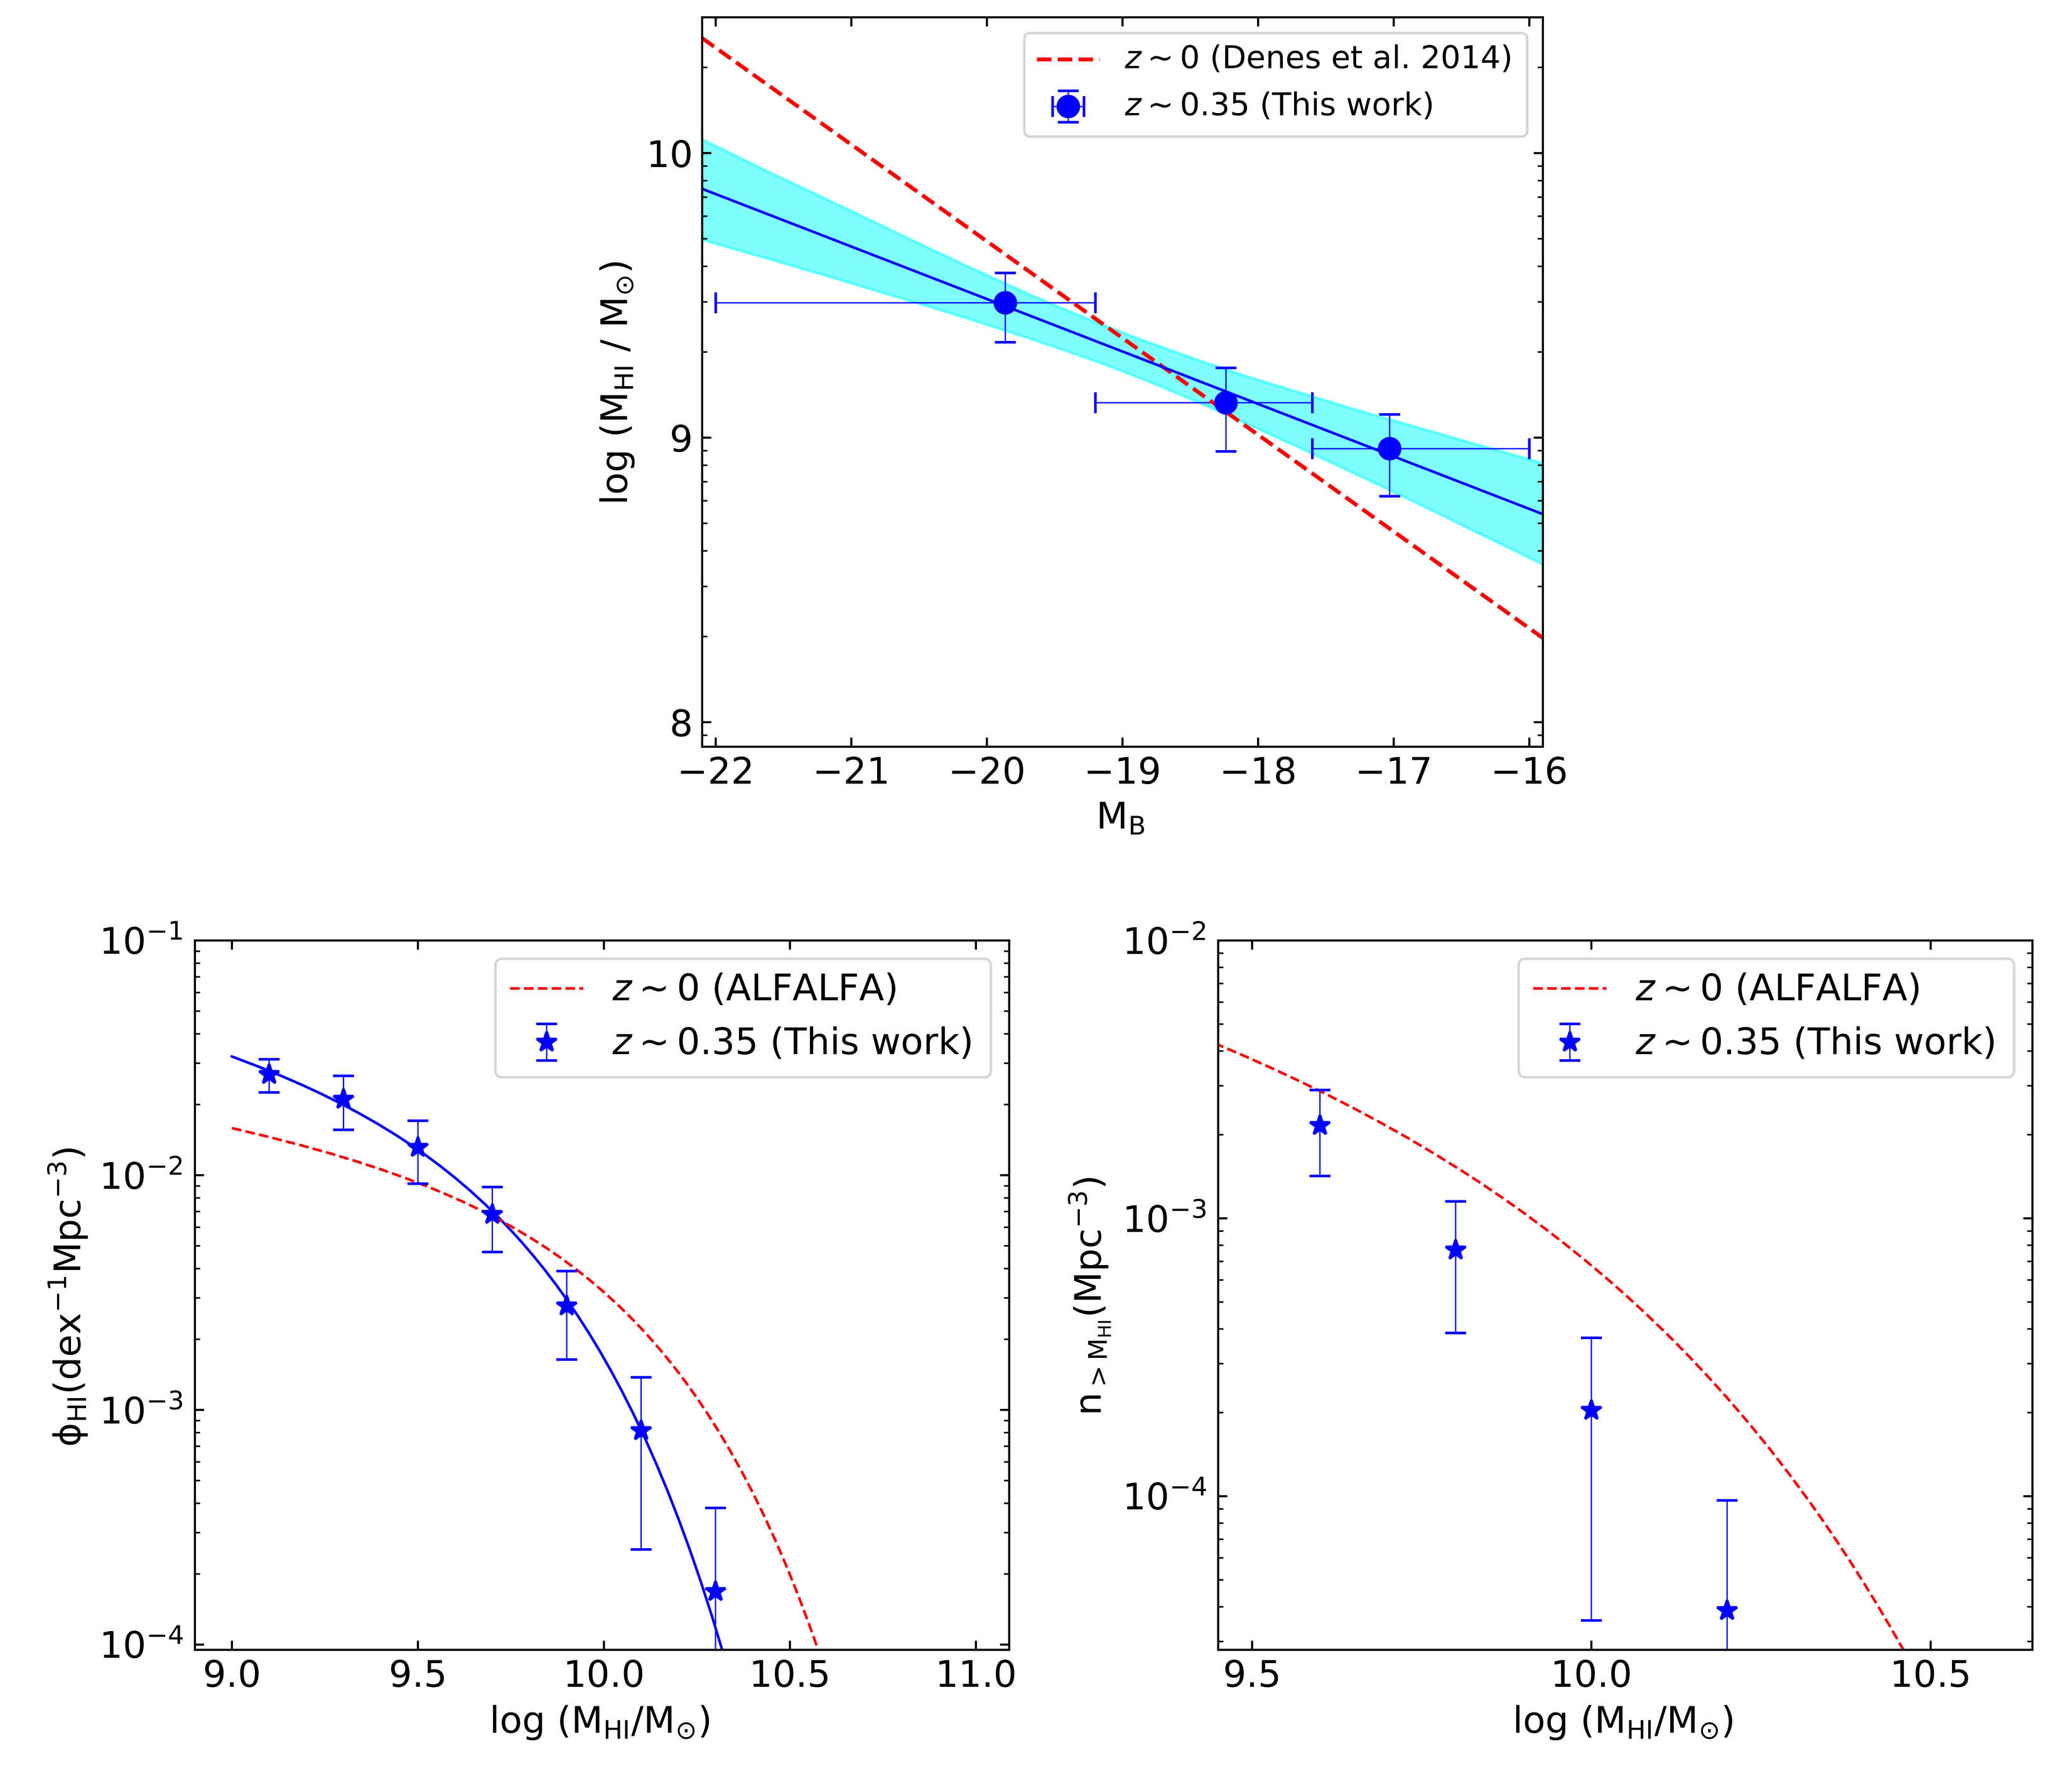
The HI mass function of star-forming galaxies at z~0.35
The neutral atomic hydrogen (HI) mass function describes the distribution of the HI content of galaxies at any epoch; its evolution provides an important probe of models of galaxy formation and evolution. Unfortunately, the weakness of the HI 21cm line has meant that it has hitherto not been possible to determine the HI mass function of galaxies at cosmological distances. While measuring the HI masses of a large number of galaxies at intermediate redshifts remains challenging today, it is possible to stack the HI 21cm spectra of individual galaxies and measure the average HI mass of the population. Further, stacking the HI 21cm spectra of galaxies as a function of their optical luminosities can be used to obtain the dependence of the average HI mass on the galaxy luminosity. This can then be combined with the optical luminosity function to infer the HI mass function. This interesting approach was used by Bera et al. to obtain the first estimate of the HI mass function at intermediate redshifts: they used Giant Metrewave Radio Telescope HI 21cm spectroscopy of blue star-forming galaxies in the Extended Groth Strip to determine the scaling relation between the average HI mass (M_HI) and the absolute B-band magnitude (M_B) of such galaxies at z~0.35, by stacking the HI 21cm emission signals of galaxy subsamples in different M_B ranges. This M_HI-M_B scaling relation at z~0.35 is shown in blue in the top panel of the figure, with the corresponding relation in the local Universe shown as the dashed red line. They then combined this M_HI-M_B scaling relation with the known B-band luminosity function of star-forming galaxies at these redshifts to determine the HI mass function at z~0.35. They also demonstrated that the use of the correct scatter in the M_HI-M_B relation is critical for an accurate estimate of the mass function; their estimate of the mass function at z~0.35 assumes that the scatter in the relation at this redshift is the same as that in the local Universe. Bera et al. found that the HI mass function has evolved significantly from z~0.35 to today, i.e. over the last four billion years, especially at the high-mass end (this can be seen clearly in the bottom left panel of the figure). High-mass galaxies, with HI masses larger than roughly 10 billion solar masses, are a factor of ~3.4 less prevalent at z~0.35 than at z~0 (as can be seen in the bottom right panel of the figure). Conversely, there are more low-mass galaxies, with HI masses of roughly a billion solar masses, at z~0.35 than in the local Universe. These results suggest that massive star-forming galaxies have acquired a significant amount of neutral atomic gas through mergers or accretion from the circumgalactic medium over the past four billion years.
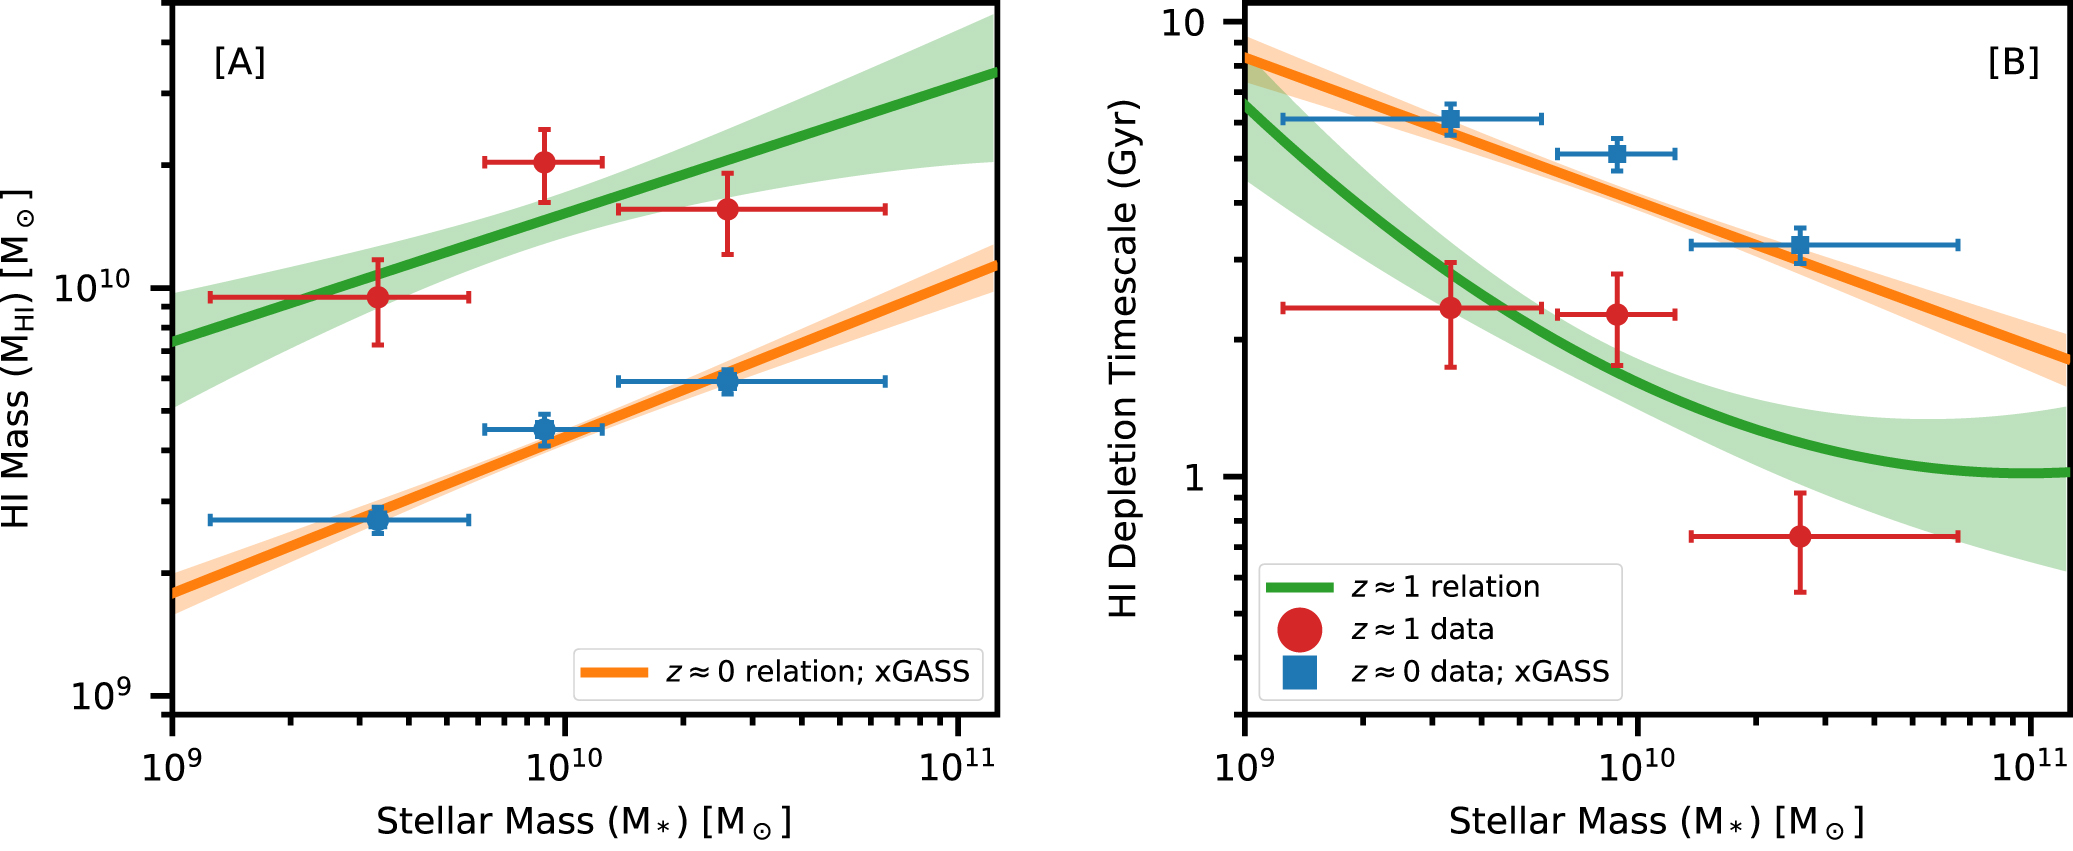
Atomic Gas Scaling Relations of Star-forming Galaxies at z~1
Gas and stars are the key baryonic constituents of galaxies with neutral atomic hydrogen gas (HI) being the primary fuel for star formation. In the nearby Universe, the HI properties of galaxies have been found to correlate with their various other galaxy properties through the "recentResults"HI scaling relations , essentially relations between the HI mass of the galaxies and the stellar mass, luminosity, size, etc. The scaling relations quantify the connections between gas and stellar properties of galaxies, and thus contain information about the balances between the complex processes underlying galaxy evolution. The existence and the redshift evolution of such scaling relations provide a critical constraint on models of galaxy evolution. While detailed HI 21cm studies of nearby galaxies have yielded accurate determinations of the HI scaling relations in the local Universe, the weakness of the HI 21cm line has meant that it has not so far been possible to determine these relations at cosmological distances. Chowdhury et al. used the Giant Metrewave Radio Telescope (GMRT) Cold-HI AT z~1 (CATz1) survey, a 510 hr HI 21 cm emission survey of galaxies at z = 0.74-1.45, to report the first measurements of the HI scaling relations in star-forming galaxies at z~1, nine billion years ago. The authors divided their sample of ~11,500 galaxies at z~1 into three subsamples with different stellar mass ranges, to measure the average HI masses of galaxies with different average stellar masses. Chowdhury et al. find that the relation between HI and stellar mass at z~1 has the same slope as in the local Universe, but is a factor of ~3.5 higher in normalization. This implies that the average HI masses of galaxies over a wide range of stellar mass are higher by this factor than those of nearby galaxies with similar stellar masses. The authors also measured the relation between the HI depletion timescale (the timescale on which the HI in the galaxy would be entirely converted to stars, at the current star formation rate) and the stellar mass, finding that this relation lies a factor of 2-4 lower than the corresponding relation in the nearby Universe. Chowdhury et al. also find that the efficiency with which HI is converted to stars is much higher for galaxies at z~1 than for those in the nearby Universe. The figure shows [A] the average HI mass and [B] the average HI depletion timescale of galaxies, as a function of the stellar mass, in the nearby Universe (blue points) and at z~1 (red points).
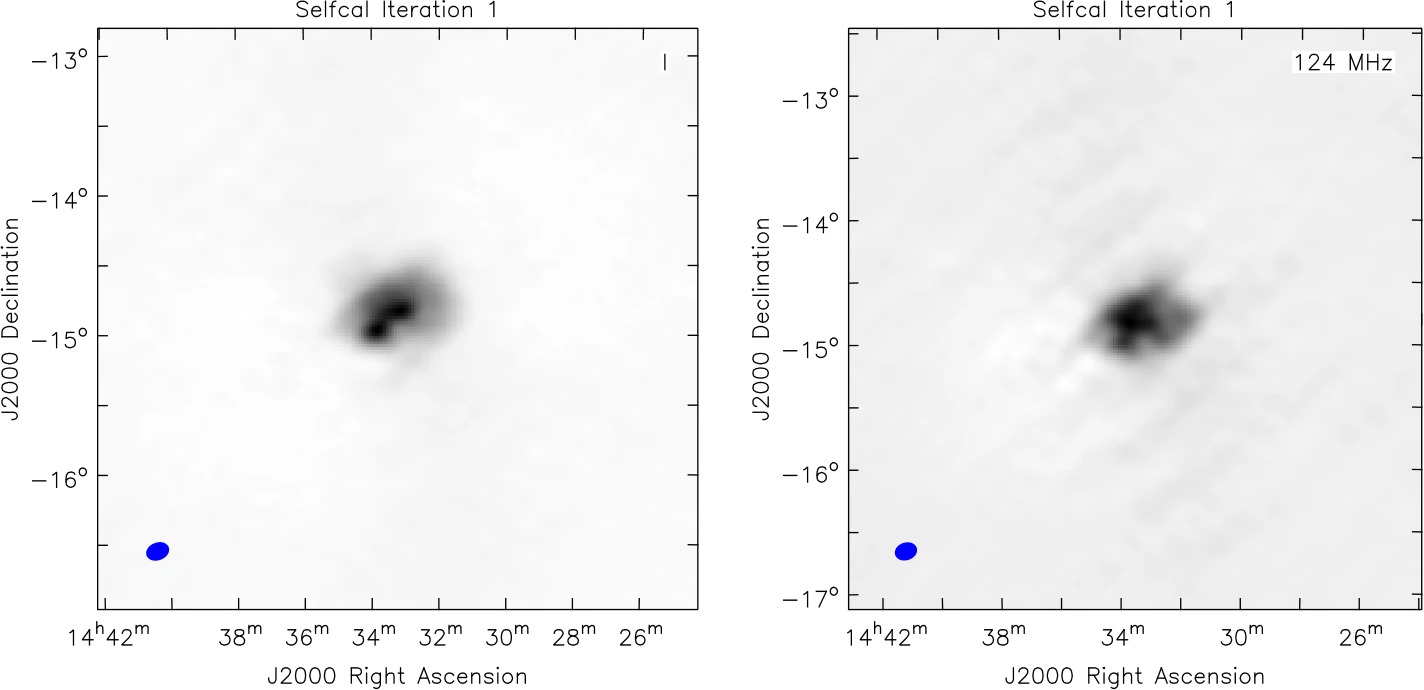
Working Principle of the Calibration Algorithm for High Dynamic Range Solar Imaging with the Square Kilometre Array Precursor
Metre-wavelength solar emission spans angular scales from a few arcminutes to a few degrees. The brightness temperature of these emissions also varies by several orders of magnitude. Often, the faint radio emission from the quiet solar corona or coronal mass ejections is present simultaneously with the very bright radio emissions from solar radio bursts. To understand the global coronal properties, one has to detect both types of emissions simultaneously. At radio wavelengths, one cannot use a coronagraph to block the bright emission. Hence, one requires high-dynamic-range imaging to detect faint emission in the presence of very bright emission. The combination of the unique array configuration of the Murchison Widefield Array (MWA) and the robust calibration and imaging pipeline, Automated Imaging Routine for the Compact Arrays for the Radio Sun (AIRCARS, Mondal et al. 2019), produces the best spectroscopic snapshot solar images at low radio frequencies available to date. The present work demonstrates that even uncalibrated data from the MWA have a certain degree of coherency, which allows AIRCARS to make a reasonable starting point for boot-strapping a self-calibration algorithm even without a dedicated calibrator observation. The left panel of the figure shows an image after applying the calibration solutions from night-time calibrator observation, while the right panel shows the image made directly from the uncalibrated data which provides a reasonable starting point. The strength of this algorithm makes AIRCARS a state-of-the-art calibration and imaging pipeline for low-frequency solar imaging, which is expected to be highly suitable for the upcoming Square Kilometre Array and other future radio interferometers for producing high-dynamic-range and high-fidelity images of the Sun.
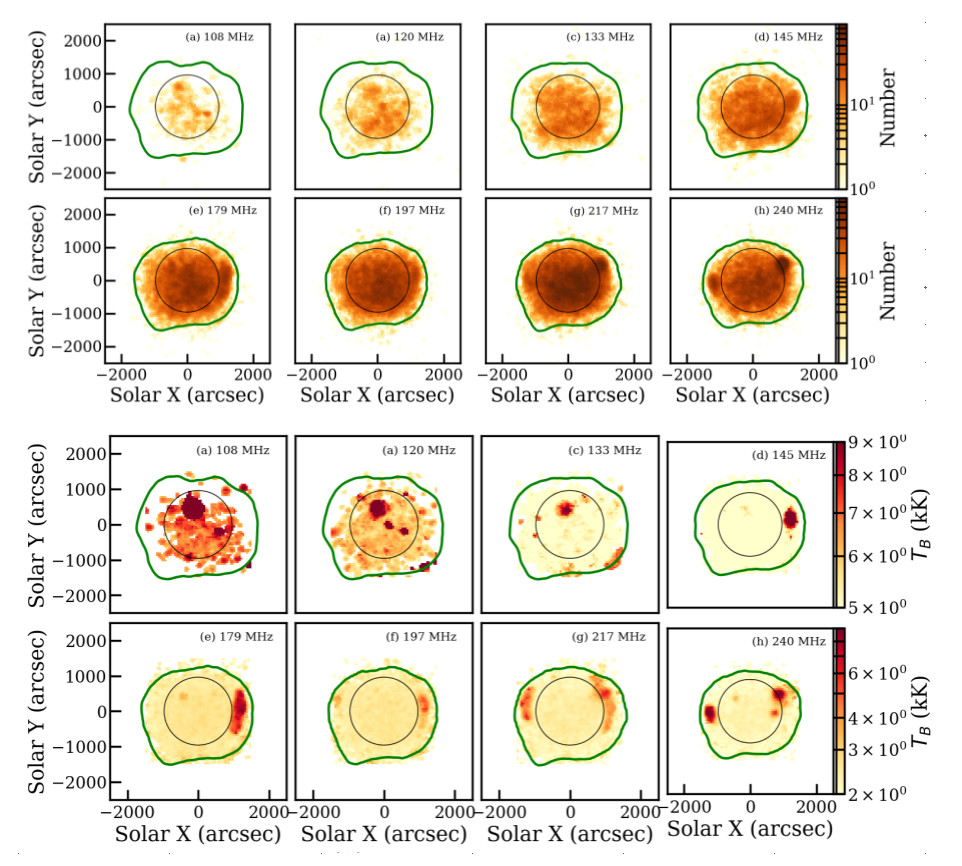
Detection of Ubiquitous Weak and Impulsive Nonthermal Emissions from the Solar Corona
A ubiquitous presence of weak energy releases is one of the most promising hypotheses to explain coronal heating, referred to as the nanoflare hypothesis. The accelerated electrons associated with such weak heating events are also expected to give rise to coherent impulsive emission via plasma instabilities in the metrewave radio band, making this a promising spectral window to look for their presence. Recently, Mondal et al. (2019) had reported the presence of weak and impulsive emissions from quiet Sun regions which seem to meet the requirements of being radio counterparts of the hypothesized nanoflares. Detection of such low-contrast weak emission signals from the quiet Sun is challenging and, given their implications, it is important to confirm their presence. In this work, using data from the Murchison Widefield Array, Sharma et al. use an independent robust approach for their detection by separating the dominant, slowly varying component of emission from the weak impulsive one in the visibility domain. By imaging these so-called ‘residual visibilities’, they detect milli-Solar Flux Unit-level bursts taking place all over the Sun and characterize their brightness temperatures, distributions, durations, and associations with features seen in extreme-UV images. The top panel of the figure shows the number of instances in a 30 min period where the residual flux density in a given pixel exceeded 6\\sigma, where \\sigma is the rms noise in the map far from the Sun for frequencies ranging from 108 MHz to 240 MHz. These features are seen to be present all over the Sun, though some clustering around active regions is seen at the highest frequencies. The lower panel shows the mean brightness temperature (Tb) of all the emission features identified in the upper panel which lies in the range of a few kK, order a percent of the solar thermal bremsstrahlung. These are among the weakest detections of non-thermal solar radio emissions. The black circle marks the optical disc of the Sun and the green contour the 5\\sigma boundary of the radio Sun. Sharma et al. also constrain the energies of the nonthermal particles using inputs from the FORWARD coronal model along with some reasonable assumptions, and find them to lie in the subpico flare (~10^19-10^21 erg) range. They also report the discovery perhaps the weakest known type III radio burst yet and another emission feature showing the weakest known clear signature of the quasi-periodic pulsations.
The Giant Metrewave Radio Telescope Cold-HI AT z ~ 1 Survey
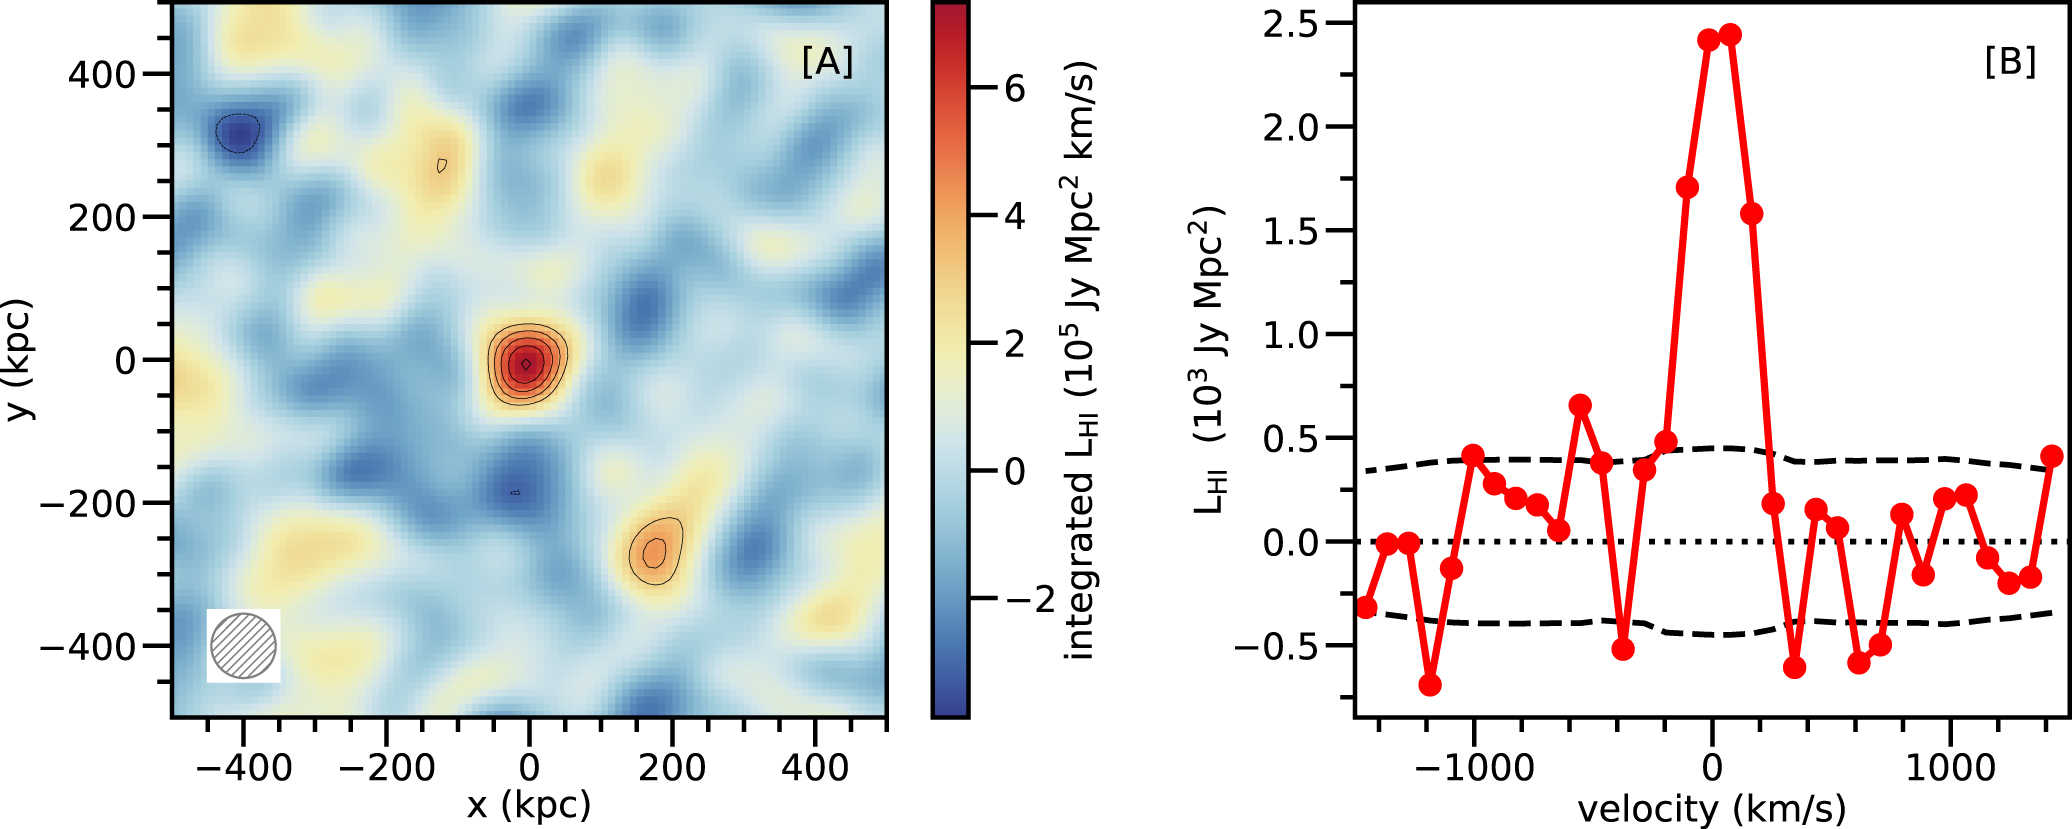
Neutral atomic hydrogen (HI) is the primary fuel for star formation in galaxies. An understanding of galaxy evolution thus critically requires measurements of the atomic gas mass of galaxies over cosmological time. Unfortunately, the weakness of the HI 21 cm line, the only tracer of the HI mass of galaxies, has meant that, until very recently, nothing was known about the HI mass of high-redshift galaxies. Chowdhury et al. had used the upgraded Giant Metrewave Radio Telescope (GMRT) in 2020 to obtain the first measurement of the average HI mass of galaxies at z~1, nine billion years ago. The team has now followed this up with a much larger survey, the GMRT Cold-HI AT z~1 (CATz1) survey, a 510 hr upgraded GMRT survey aimed at characterizing HI in galaxies during and just after the epoch of peak star formation activity in the universe (often referred to as "recentResults"the epoch of galaxy assembly ), a key epoch in galaxy evolution. In the current paper, Chowdhury et al. describe the design, data analysis, and basic results of the GMRT-CATz1 survey. They combined ("recentResults"stacked ) the HI 21 cm emission signals of ~11,500 star-forming galaxies at z=0.74-1.45 to obtain a high (7.1-sigma) significance detection of the average HI 21 cm signal from the sample of galaxies. The detected HI 21 cm signal can be clearly seen in the adjacent figure in both [A] the stacked HI 21 cm image, and [B] the stacked HI 21 cm spectrum. The average HI mass of the galaxies inferred from the detected signal is a factor of 1.4 higher than the average stellar mass of the galaxies, and a factor of ~3.5 higher than the HI mass of galaxies with similar stellar masses in the local Universe. However, Chowdhury et al. find that even such a large HI reservoir will be able to sustain the high star-formation rate of these galaxies for only a short duration, ~1.7 Gyr. Chowdhury et al. thus find that although galaxies at z ~ 1 have a high HI mass, their short HI depletion timescale is likely to cause quenching of their star formation activity in the absence of rapid accretion of gas from the environment around the galaxies. The GMRT-CATz1 survey will allow detailed studies of the HI properties of high-redshift galaxies, providing, for the first time, an understanding of atomic gas in galaxies during and just after the epoch of galaxy assembly. A set of companion papers by Chowdhury et al. has already yielded exciting new insights on these issues.
Wide-band Timing of GMRT-discovered Millisecond Pulsars
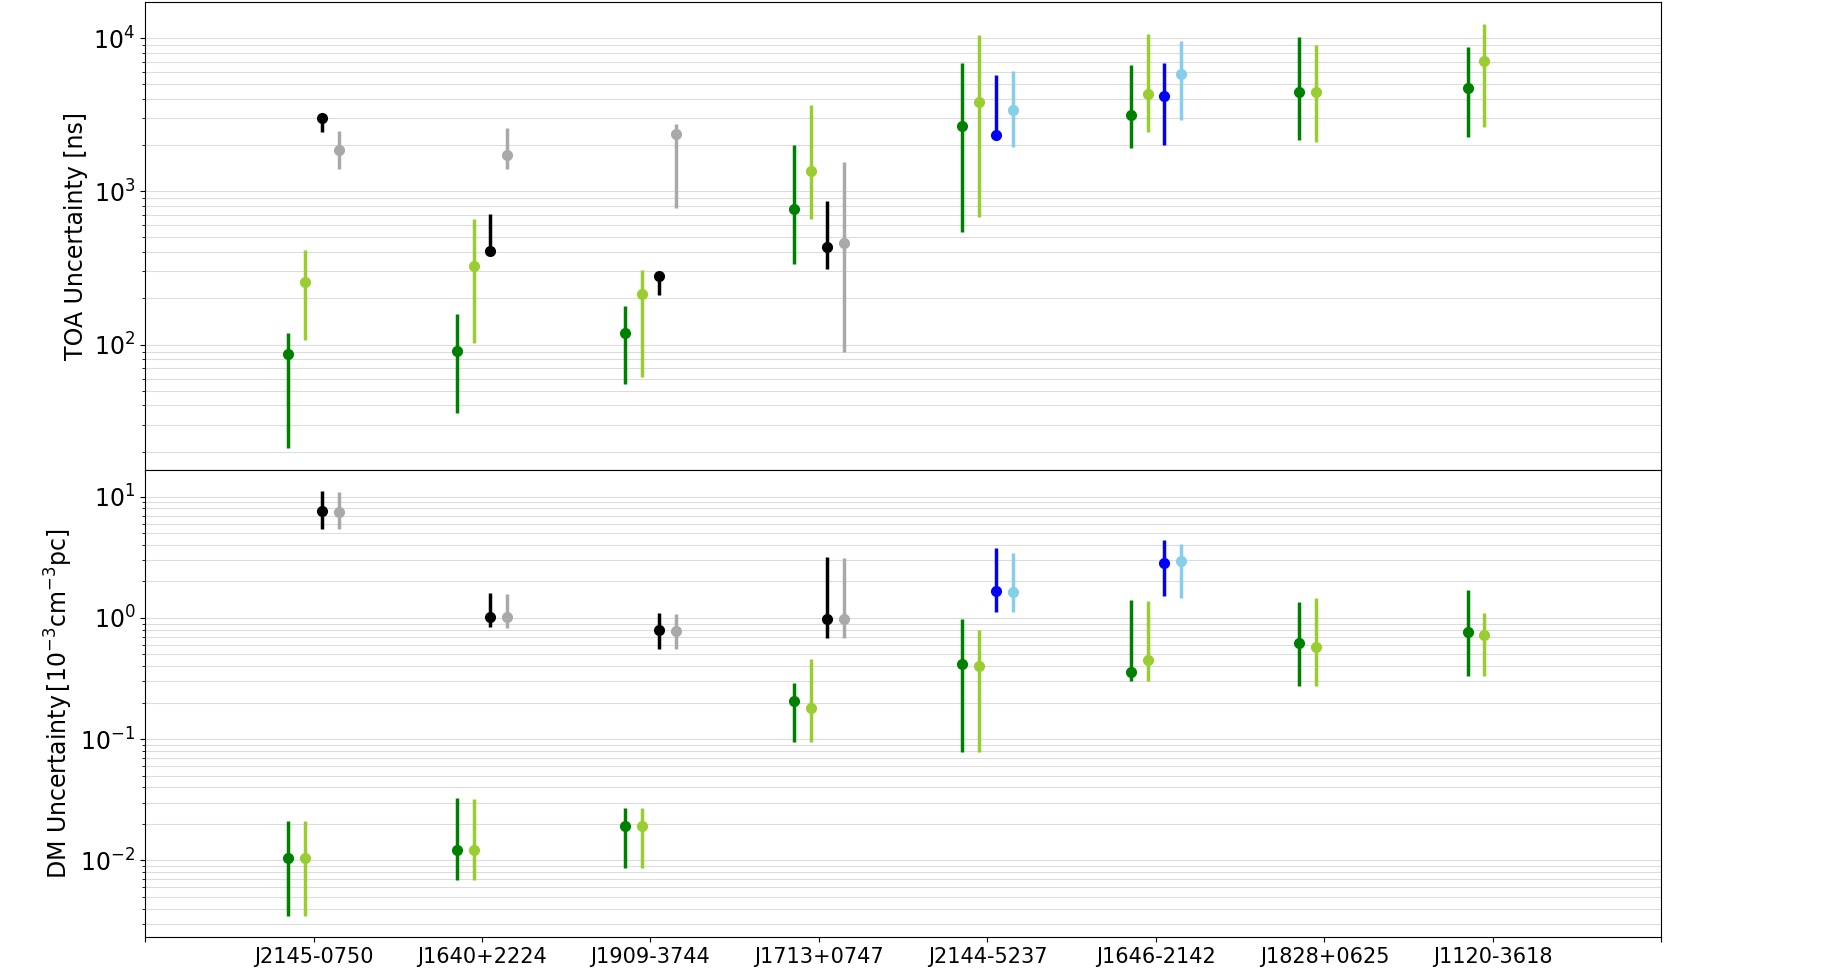
Pulsar timing array (PTA) experiments seek to detect the nanoHertz region of the gravitational wave (GW) spectrum, which is thought to be produced by an ensemble of supermassive blackholes. A PTA is composed of an array of millisecond pulsars (MSPs) distributed over the sky that have exceptional rotation stability. The angular correlation between the residuals of the arrival times of pairs of MSPs is used to search for stochastic GW signals. However, the timing data can be heavily contaminated by frequency-dependent effects caused by the interstellar medium or inherent in pulsars (profile evolution). Modeling of frequency-dependent effects is required to mitigate the timing noise to increase sensitivity towards the expected GW background imprints in pulsar timing data. Sharma et al. describe a timing study for a group of eight millisecond pulsars with the upgraded GMRT, aided by the large fractional bandwidth, at observing frequencies ranging from 300 to 1460 MHz. The authors used PulsePortraiture-based wide-band timing analysis, rather than traditional narrow-band analysis with a frequency invariant template profile, to account for the frequency evolution of the profile of pulsar. The wide-band timing method yielded a time of arrival (ToA) precision in Band-3 (300-500 MHz) of order of a micro-sec and a dispersion measure (DM) precision of 10^-4 pc cm^-3 for GMRT-discovered pulsars, and of sub-micro-sec (ToA) and 10^-5 pc cm^-3 (DM) for PTA pulsars. Sharma et al. demonstrate the significance of allocating the entire GMRT array to a single low-frequency band for precise intra-band DM measurements. The effectiveness of profile-modeling at low frequencies is demonstrated by this wide-band timing study over a broad frequency range. This study investigates the possibility of using newly-discovered GMRT pulsars in the PTA experiment and the achievable long-term timing precision for them. The figure shows median ToA (top panel) and DM (bottom panel) uncertainties obtained in the two (narrow-band and wide-band) analyses for eight pulsars. Error bars represent the range of precision obtained for the individual pulsar data sets. Pulsars are arranged on the x-axis in increasing order of their Band-3 DM uncertainty. Green, blue, and black colours are used to represent the values obtained from wide-band analysis in Bands 3, 4, and 5, respectively. Similarly, light-green, sky-blue, and dark-gray colours are used for narrow-band analysis values in Bands 3, 4, and 5, respectively. In general, ToAs are more precise in wide-band analyses than in narrow-band analyses; however, the DM precisions are similar for both the techniques.
Atomic Gas Dominates the Baryonic Mass of Star-forming Galaxies at z ~ 1.3
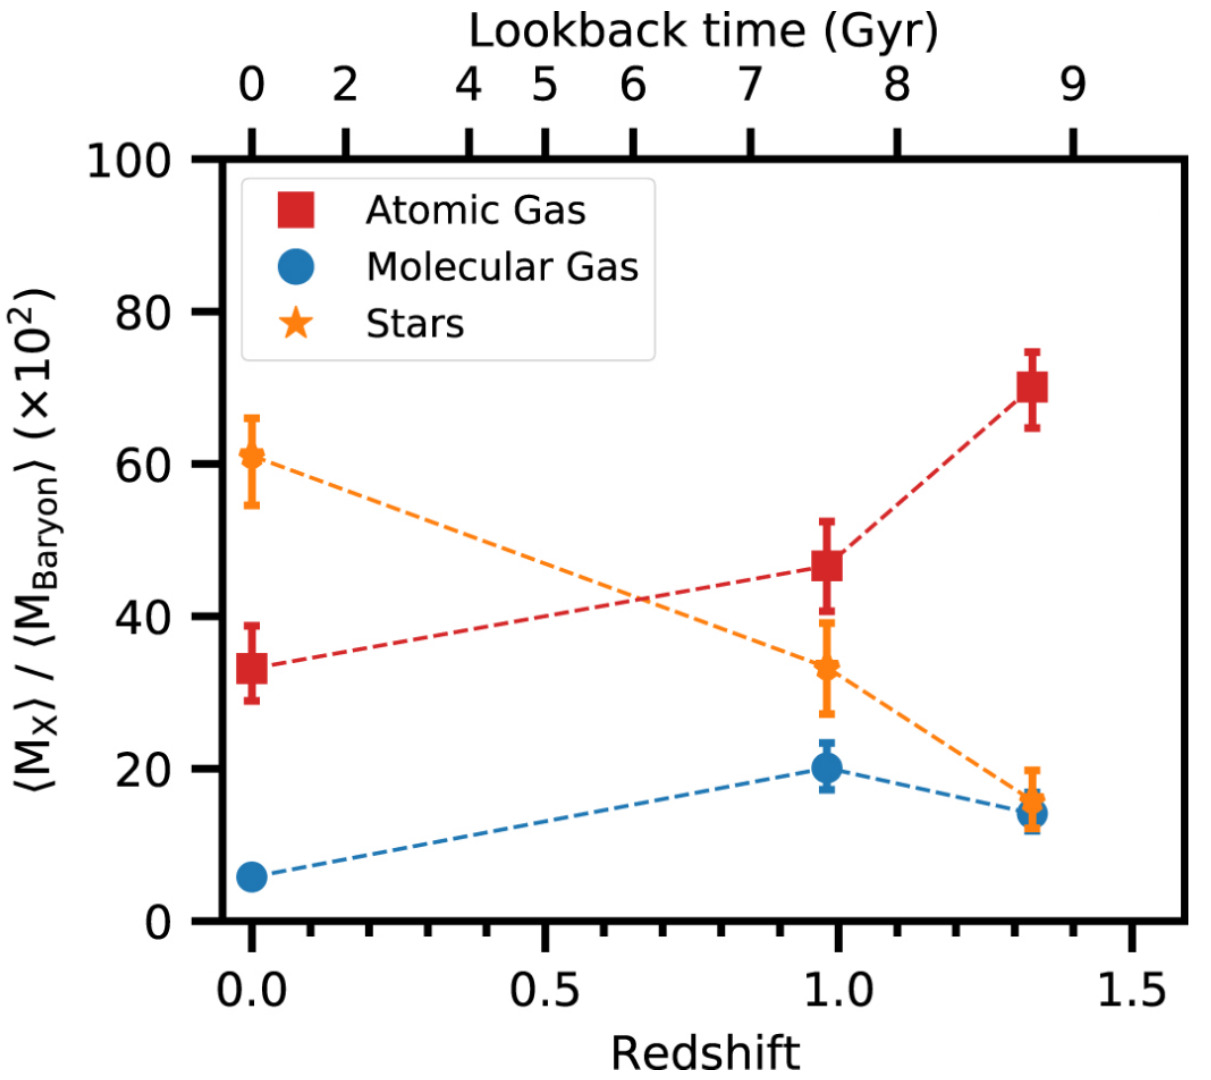
Ordinary "recentResults"baryonic matter in galaxies is mostly in the form of stars and neutral atomic and molecular gas. Over the lifetime of a galaxy, neutral atomic gas gets converted to molecular gas which in turn gets converted to stars. A galaxy s baryonic composition is thus one of its fundamental properties, and an important indicator of its evolutionary stage. The distribution of the baryonic mass of galaxies in the early Universe between stars, atomic and molecular gas, has hence long been an open problem in galaxy evolution. Unfortunately, the weakness of the HI 21 cm line, the only direct tracer of the atomic gas mass of galaxies, has meant that, until very recently, the atomic gas masses of high-redshift galaxies were not known. Chowdhury et al. used their recent detection of the average HI 21 cm emission signals from a large sample of star-forming galaxies at z~1.0 and at z~1.3 to find that high-redshift galaxies, at the epoch of peak star-formation activity in the Universe, have a dramatically different baryonic composition from that of nearby galaxies. The adjacent figure shows the fraction of the average baryonic mass of galaxies in atomic gas (red), molecular gas (blue), and stars (yellow) at z~0, z~1.0, and z~1.3; the samples of galaxies at the three epochs have identical stellar mass distributions. The figure shows that the contribution of stars to the total baryonic mass has increased from approximately 16% at z~1.3 to roughly 60% in the nearby Universe. Conversely, the fraction of mass in molecular gas for such galaxies has declined from about 14% at z~1.3 to only 6% in the nearby Universe. Remarkably, Chowdhury et al. find that atomic gas dominates the baryonic mass of galaxies at z~1.3, with roughly 70% of the total baryonic mass in atomic gas, and only around 16% in stars. Overall, the study provides evidence for strong evolution in the baryonic composition of galaxies over the past 9 billion years, with early galaxies, at the peak of star-formation activity in the Universe, being predominantly made up of neutral gas.
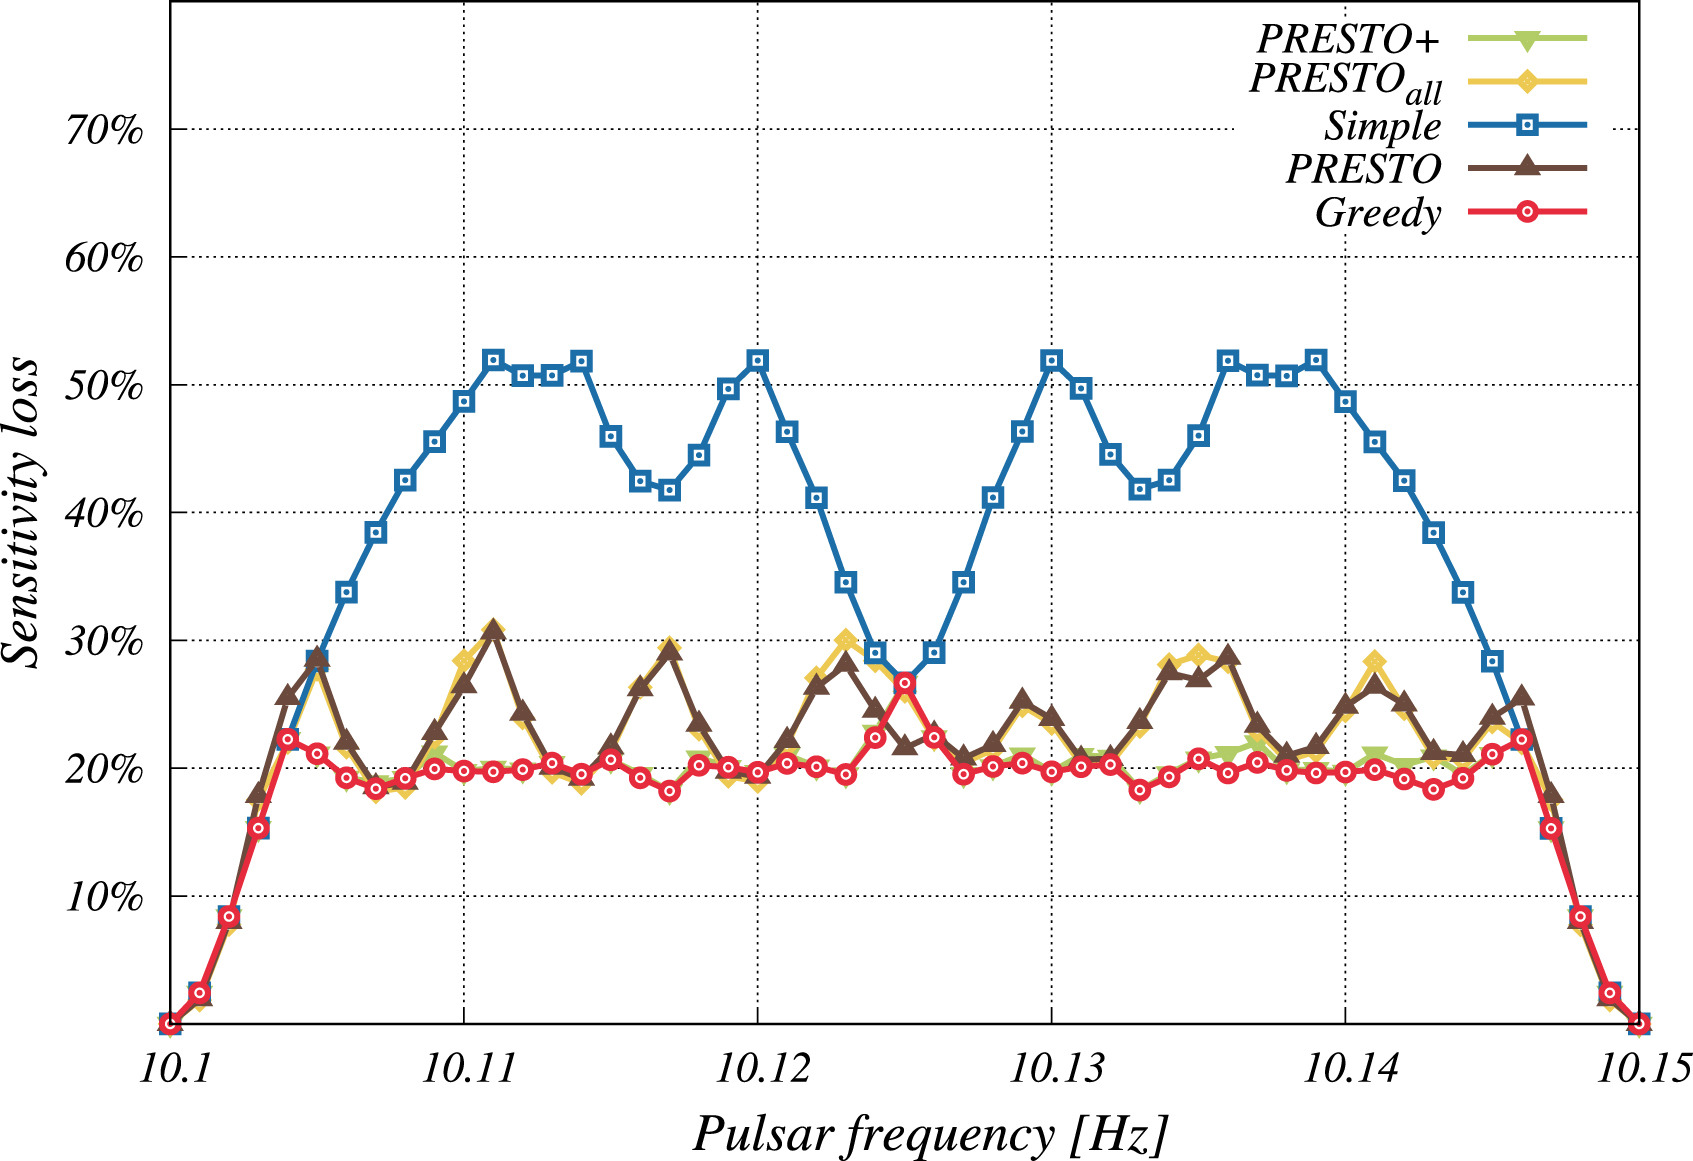
A novel greedy approach to harmonic summing using GPUs
A convenient and computationally efficient way of detecting pulsars in a time-domain search is to use the technique of Fourier transform. The Fourier transform distributes the power contained in the pulsar’s signal into the fundamental frequency bin and multiple higher harmonic bins. The incoherent harmonic sum aims to increase the pulsar’s signal-to-noise ratio (SNR) by accounting for power (either fully or partially) from an increasing number of harmonics. However, in such harmonic sum algorithms, there are limitations due to unfavourable memory access patterns (which significantly reduces data utilisation per cache-line) and the number of possible partial sums explored per a single fundamental bin. For example, the Lyne-Ashworth algorithm (described in Lorimer and Kramer 2004) used in the SIGPROC software package, sums only powers-of-two harmonics. The harmonic sum algorithm used in the PRESTO software package (Ransom 2002) also uses a subset of the harmonics. This paper reports a new harmonic sum algorithm based on a greedy approach and implementation of this on NVIDIA GPUs using the CUDA programming language. This algorithm determines which time samples to sum according to the short-term gains rather than finding the optimal sum of harmonics. The Greedy harmonic sum considering all harmonics, not only powers-of-two, achieves higher sensitivity with a performance similar to or higher than the standard harmonic sum algorithms. The figure presents a comparison between the Greedy harmonic sum algorithm and the PRESTO harmonic sum algorithm (which sums only even harmonics), its two modified versions, one that sums elements of all higher harmonics (PRESTOall) and another that performs the harmonic sum for all harmonic orders in addition to summing all higher harmonics (PRESTO+), and a simple harmonic sum which ignores the drift and sums only integer multiples of the fundamental bin. The Greedy algorithm encounters minimum sensitivity loss as a function of pulse frequency similar to PRESTO+. The GMRT High Resolution Southern Sky (GHRSS) survey data analysis with Greedy Harmonic sum reports 10-30% more recovered SNRs than with PRESTO. The compute performance of the new algorithm in terms of the number of fundamental frequency bins processed per second is 10% faster than PRESTO and >50% faster than the updated version of PRESTO (PRESTO+). Thus, the new Greedy harmonic sum algorithm has lower signal loss and better-recovered SNR than the standard algorithm used in PRESTO while achieving similar or better performance in the number of processed fundamental frequency bins per second.
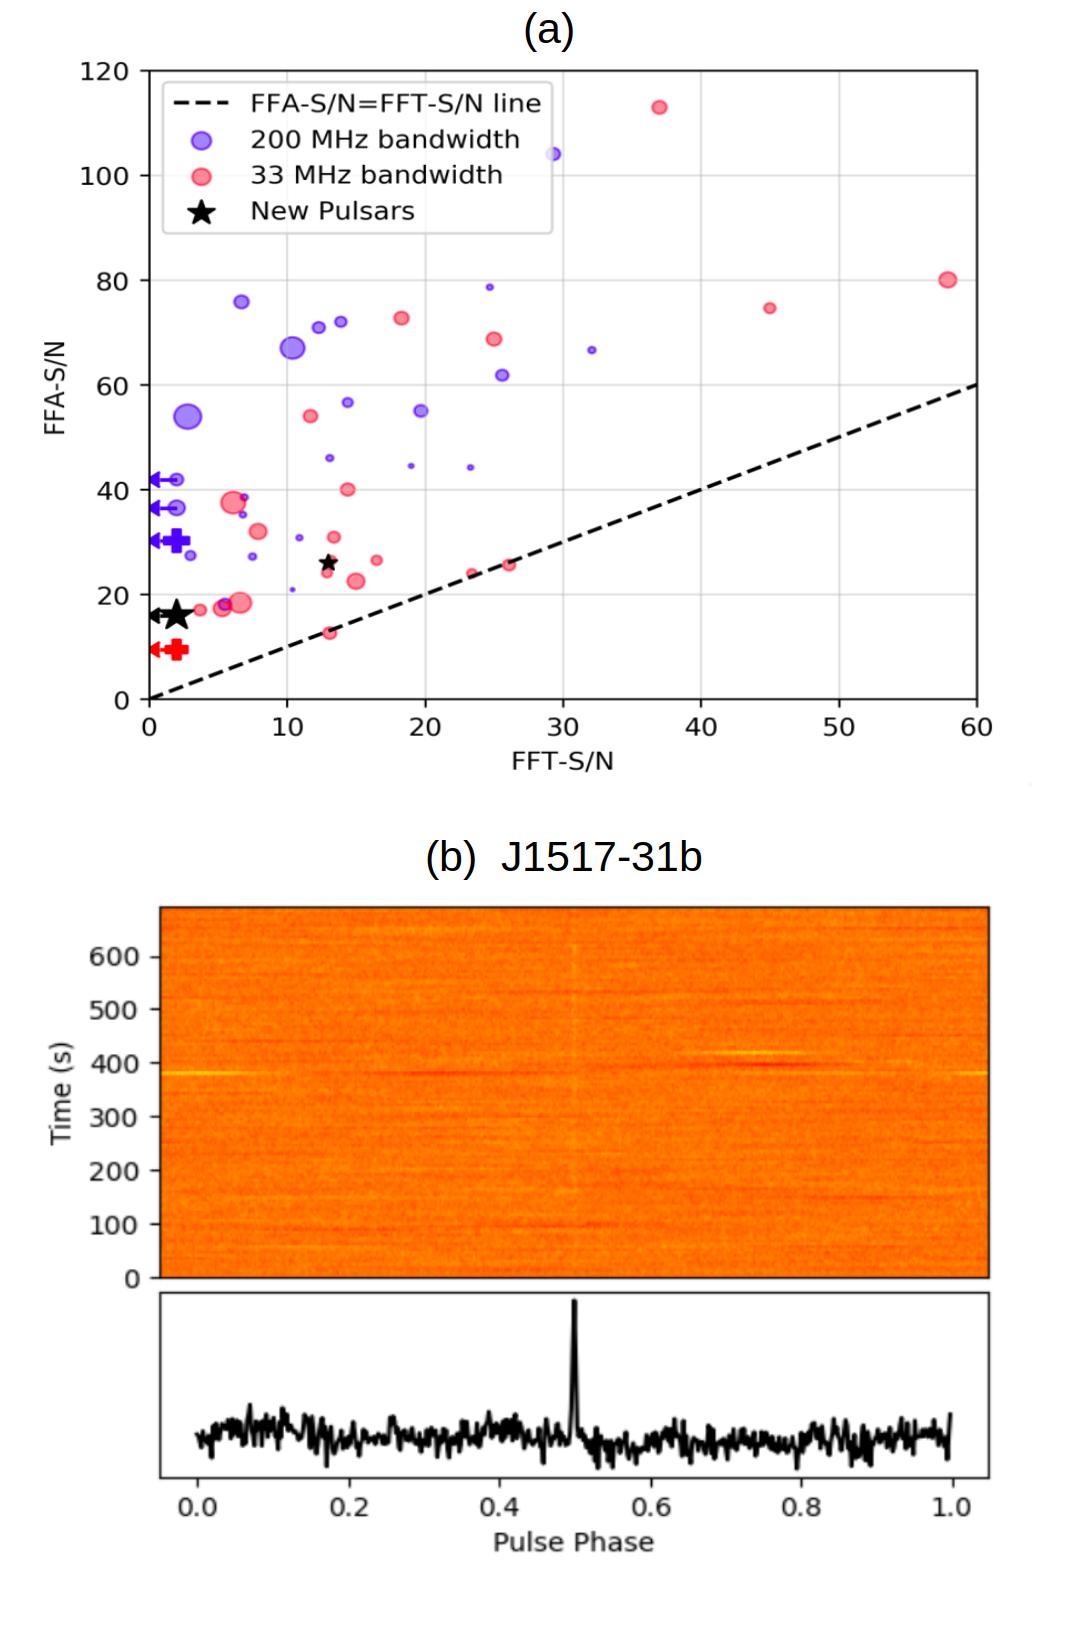
The GMRT High Resolution Southern Sky Survey for Pulsars and Transients. III. Searching for Long-period Pulsars
Standard pulsar radio emission models predict a critical value of period derivative (P_dot) corresponding to the spin period (P) of pulsars below which radio emission ceases. These critical values of period and period derivative trace a curve on the P-P_dot plane called the death-line. No radio pulsar should exist below this line. The discovery of long period pulsar J2144-3933 and its location on the P-P_dot plane has questioned all the existing radio emission models, but there are only a handful of such interesting objects. Over the last decade, the number of millisecond pulsars has increased four-fold, whereas there has been only a marginal increase in the number of long-period pulsars. Along with intrinsic and observational biases, susceptibility of conventional fast Fourier transform (FFT)-based searches to red noise can be the primary reason behind the lack of long period pulsars. Searching for periodic non-accelerated signals in the presence of ideal white noise using the fully phase-coherent fast-folding algorithm (FFA) is theoretically established as a more sensitive search method than the FFT search with incoherent harmonic summing. Some major pulsar surveys (e.g. SUPERB and PALFA) have implemented FFA search to get optimal sensitivity for long period pulsars. This paper reports a detailed comparative study of FFA and FFT search sensitivity under various noise conditions (ideal white noise, real telescope noise, and simulated red noise) and over a range of signal parameters (period, duty-cycle, and profile shape). Singh et al. find that the FFA search with appropriate de-reddening of the time series performs significantly better than the FFT search with spectral whitening for long-period pulsars under real noise conditions. They describe an implementation of an FFA-based search pipeline for the GMRT High Time Resolution Southern Sky (GHRSS) survey. With processing of 1500 square degrees of GHRSS sky, the paper reports the re-detection of 43 known pulsars and the discovery of 2 new pulsars. Panel (a) of the figure shows a comparison of FFA and FFT detection signal-to-noise (S/N) of these pulsars. All these pulsars are better detected in the FFA search and the long-period pulsars have a higher ratio of FFA to FFT detection significance. Five of these pulsars were missed by the FFT search. Panel (b) of the figure shows the time versus phase and folded profile plots for a newly-discovered pulsar J1517-31b, with a period of 1.1 s and at a DM of 61.7 pc-cm^{-3}. This pulsar, with a long period and an unusually narrow duty-cycle, was missed by the FFT search. The authors find that the FFA search can reduce the algorithmic bias against long-period pulsars. Increased observing time per pointing along with the implementation of the FFA search in major pulsar surveys will possibly recover the missing population of long-period pulsars and populate the region close to the death-line in the P-P_dot plane.
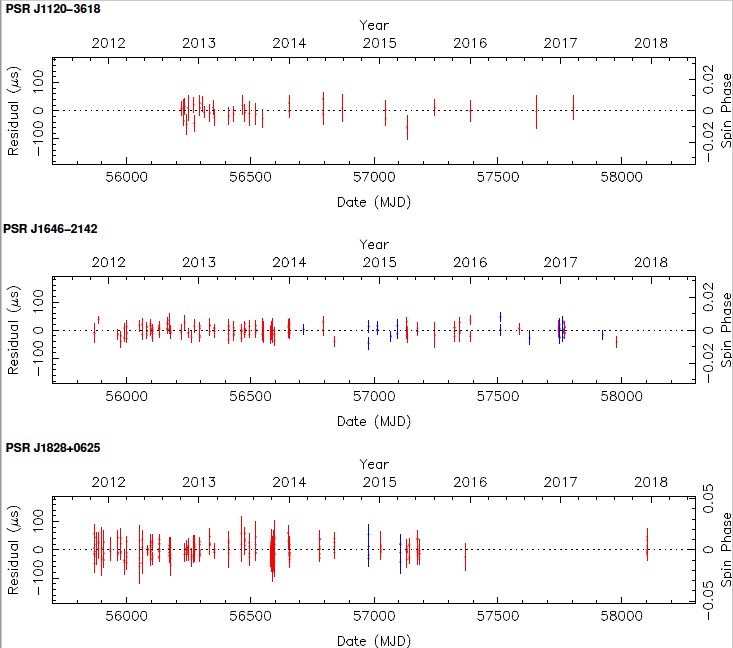
Serendipitous Discovery of Three Millisecond Pulsars with the GMRT in Fermi-directed Survey and Follow-up Radio Timing
Only a minor fraction (~15%) of the known pulsars spin with millisecond periodicity. The intrinsic faint nature of millisecond pulsars (MSPs) have hindered the discovery of these objects. This paper reports the discovery of three MSPs: PSRs J1120-3618, J1646-2142, and J1828+0625 with the Giant Metrewave Radio Telescope (GMRT) at a frequency of 322 MHz using a 32 MHz observing bandwidth. These sources were discovered serendipitously while conducting deep observations to search for millisecond radio pulsations in the directions of unidentified Fermi Large Area Telescope (LAT) gamma-ray sources. Phase coherent timing models for these newly discovered MSPs were derived using ~5 yr of observations with the GMRT. These are plotted in the figure, where the red points denote the timing residuals at 322 MHz and blue at 607 MHz. PSR J1120-3618 has a 5.5 ms spin period and is in a binary system with an orbital period of 5.6 days and a minimum companion mass of 0.18 solar masses, PSR J1646-2142 is an isolated object with a spin period of 5.8 ms, and PSR J1828+0625 has a spin period of 3.6 ms and is in a binary system with an orbital period of 77.9 days and minimum companion mass of 0.27 solar masses. The two binaries have very low orbital eccentricities, in agreement with expectations for MSP-helium white dwarf systems. Using the GMRT 607 MHz receivers having a 32 MHz bandwidth, PSR J1646-2142 and PSR J1828+0625 were detected but not PSR J1120-3618. Spectral indices for these MSPs using the GMRT observations are reported in this paper. PSR J1646-2142 has a wide profile, with significant evolution between 322 and 607 MHz, whereas PSR J1120-3618 exhibits a single peaked profile at 322 MHz and PSR J1828+0625 exhibits a single peaked profile at both the observing frequencies. These MSPs do not have gamma-ray counterparts, indicating that these are not associated with the target Fermi LAT pointing. This emphasizes the significance of deep blind searches for MSPs. The serendipity of the discovery of these millisecond pulsars indicates a population of weak MSPs waiting to be discovered with deep enough blind searches.