Science Highlights
Unraveling the Eclipse Mechanism of a Binary Millisecond Pulsar Using Broadband Radio Spectra
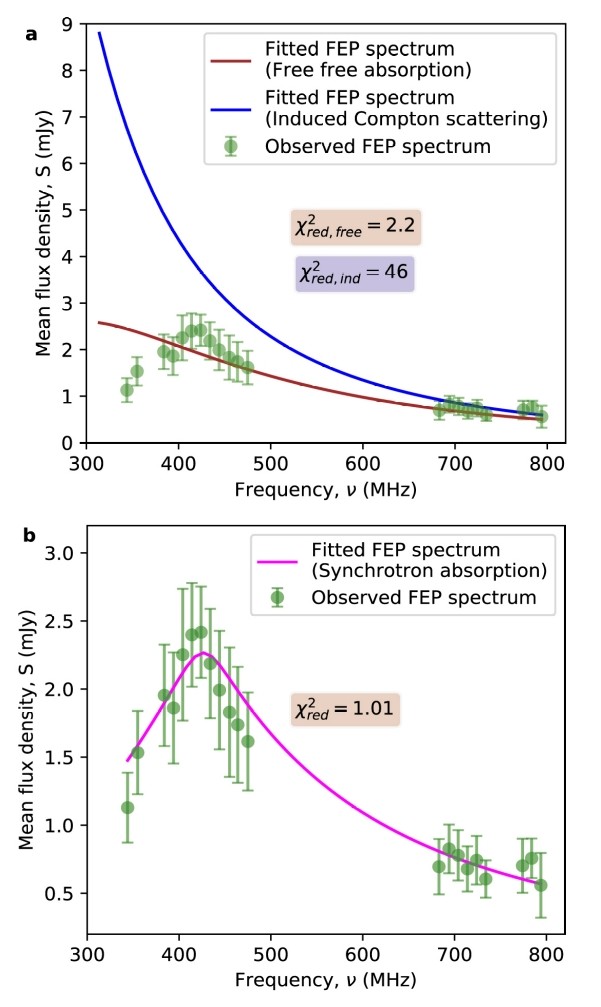
Nature’s best clocks, millisecond pulsars (MSPs), are ultra-dense dead stars that act like celestial lighthouses, with their radio light beams sweeping the Earth as fast as a few hundred times in a second. Being extremely stable rotators, MSPs act as laboratories for the study of matter in extreme conditions. MSPs often have orbital companions. In some MSP systems, the pulsar and the companion star have separations comparable to the Earth-Moon distance and interact strongly with each other in very compact orbits (<10 hrs); these are called spider MSPs. Energetic radiation from the pulsar can ablate material from the companion and blow it away; this diffuse material could eclipse the radio pulses emitted by the pulsar. Interestingly, the eclipse properties depend on the frequency of the radio pulse, with low radio frequencies being eclipsed, while high radio frequencies are not. The exact mechanism by which this occurs has not been established until now. After the first discovery of spider MSPs by Fruchter et al. (1988), only a few such systems have been studied to understand the eclipse mechanism. Most of these studies used narrow-bandwidth observations and could not probe the transition between the optically-thick and optically-thin regimes. Thus, these studies could only probe the eclipse boundary and could not determine the eclipse mechanism distinctively. For the first time, Kansabanik et al. (2021) used wide-bandwidth observations with the upgraded Giant Metrewave Radio Telescope (uGMRT) to observe a spider MSP, J1544+4937, in order to understand the frequency-dependent eclipse mechanism. They modelled the observed spectrum of the pulsar near superior conjunction at frequencies where the eclipse medium is transitioning from the optically-thick to the optically-thin regime. Simultaneous observations covering the frequency ranges 300-500 MHz and 650-850 MHz allowed them to determine the onset frequency of the eclipse as (345 +/- 5) MHz, 20 times more accurate than earlier estimates. Using this accurate eclipse onset frequency and the broadband spectrum during the full eclipse phase (FEP), Kansabanik et al. determined that the eclipse arises due to synchrotron absorption by relativistic electrons in the eclipse medium; they ruled out other possible eclipse mechanisms like scattering, scintillation, free-free absorption, and induced Compton scattering. Spectral modelling also allowed them to determine the line of sight-averaged magnetic field strength of the eclipse medium. They found that the average magnetic field strength of the eclipse medium is roughly 13 G, similar to the magnetic field strength obtained from assuming energy equipartition. The top panel of the figure shows the observed and the modelled spectra, for free-free absorption (brown line) and induced Compton scattering (blue line) as the eclipse mechanisms, respectively. It is clear that these mechanisms cannot reproduce the observed spectrum (green points) during the eclipse phase. The bottom panel shows the modelled spectrum considering synchrotron absorption (magenta line) as the eclipse mechanism; this is seen to be in good agreement with the observed spectrum (green circles).
Ultra-wideband multi-epoch study revealed the exotic nature of the first discovered ‘Main-sequence Radio Pulse emitter’ CU Virginis
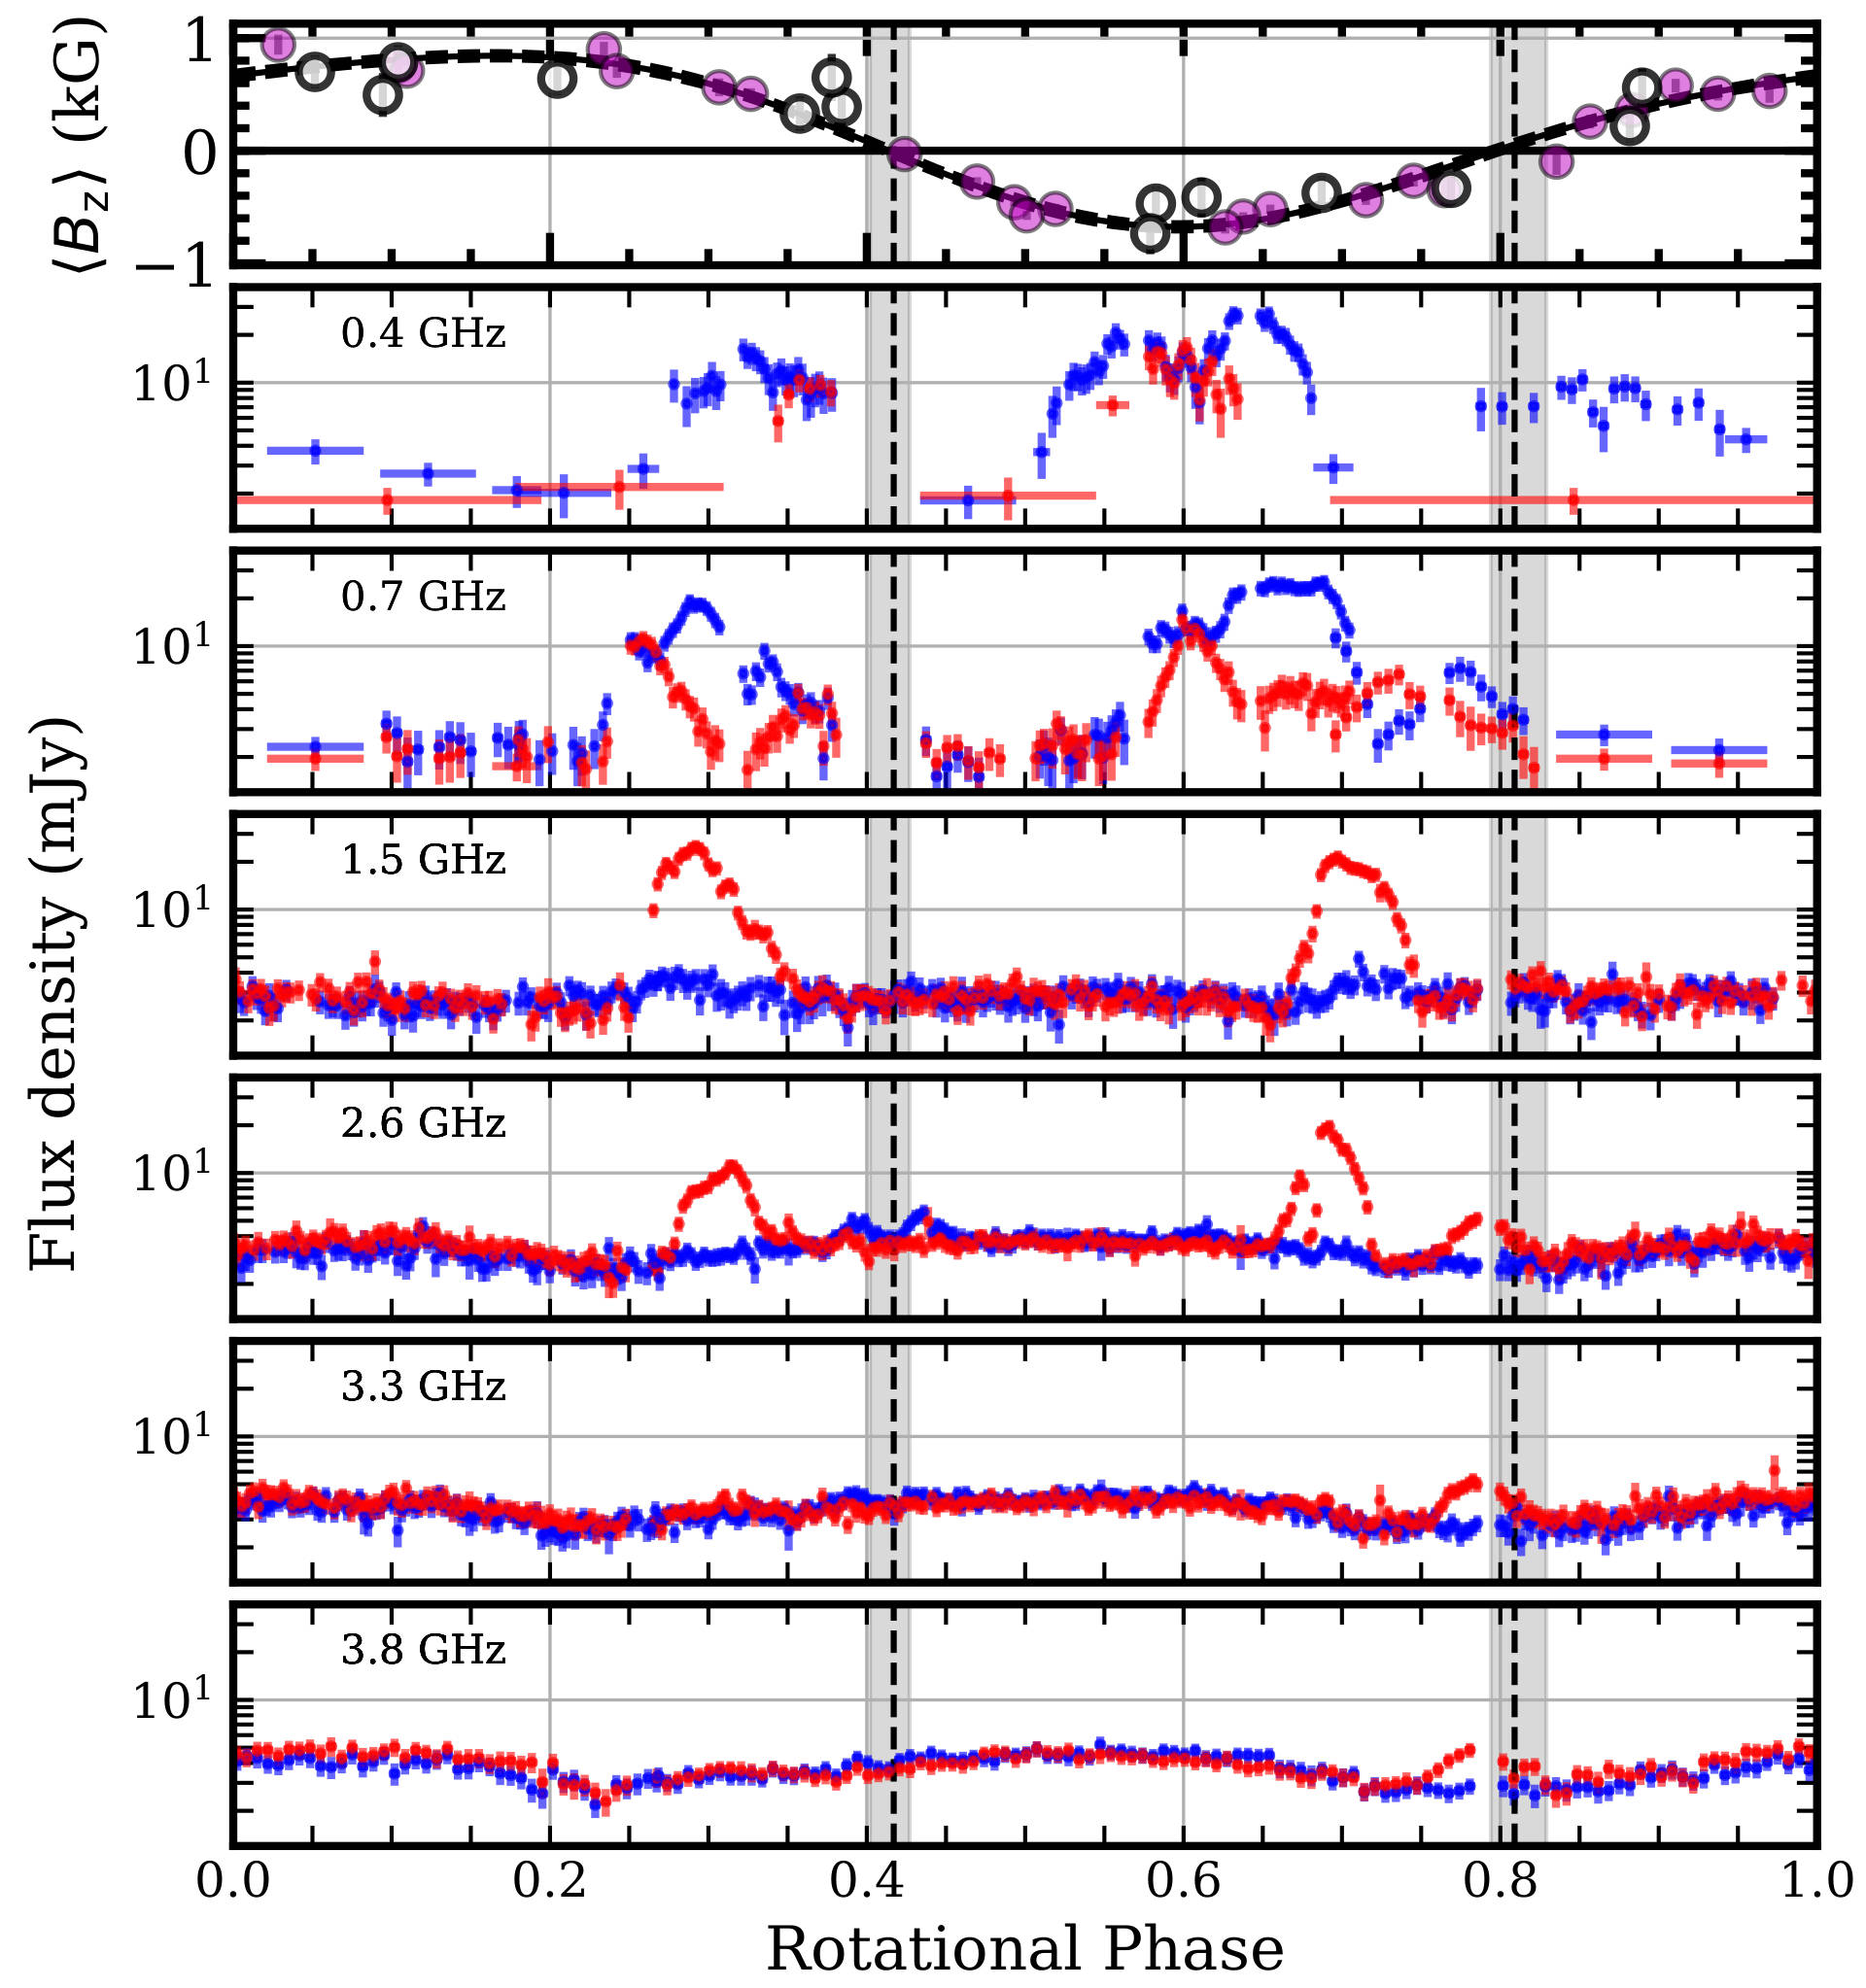
Main-sequence Radio Pulse emitters (MRPs) are main-sequence stars that emit coherent radio pulses periodically by the process of electron cyclotron maser emission (ECME). The phenomenon was first discovered from the magnetic late B-type star CU Virginis by Trigilio et al. (2000). Since then, this star has been observed several times at radio bands. While these studies have firmly established that the star always produces two right circularly polarized (RCP) pulses per rotation cycle at frequencies less than 5 GHz, all but one of the observations were carried out at frequencies above 1 GHz. The lone sub-GHz observation was carried out with the GMRT at 610 MHz, but covered only a narrow range of rotational phases. Das and Chandra, for the first time, carried out extensive observation of the star for one full rotation cycle, over the frequency range 400 MHz to 4.0 GHz, using the upgraded GMRT (uGMRT) and the Karl G. Jansky Very Large Array (VLA). Contrary to the notion that the star produces only RCP pulses, Das and Chandra discovered that the star actually produces both left (LCP) and right circularly polarized pulses. In fact, at sub-GHz frequencies, the LCP pulses are much stronger than the RCP pulses. The authors found that the star is much more active at sub-GHz frequencies in terms of the number of pulses that it emits per rotation cycle, as well as the intensity of the pulses. This kind of behavior is entirely inconsistent with current ideas about the ideal MRP behavior. Das and Chandra proposed that such an anomaly could be a signature of very strong plasma density gradients in the stellar magnetosphere, a manifestation of a complex magnetic field, or could arise due to multiple engines (e.g. satellite-induced emission) for production of ECME similar to the case of Jupiter. Apart from these peculiarities, Das and Chandra also witnessed flares from the star at sub-GHz frequencies, a phenomenon totally unexpected from a CU Virginis-like star with an extremely stable global magnetic field; they also observed a giant pulse which was nearly 10 times stronger than the typical pulses observed from this star. Das and Chandra speculate that these could be the signatures of episodic ejection of plasma from the stellar magnetosphere induced by by centrifugal force overpowering the magnetic field tension. If confirmed, the new results will open up a vast potential for this emission to become a magnetospheric probe to yield information regarding dynamical events in the apparently-stable magnetospheres of hot magnetic stars. The figure shows the light curves of the star at different frequencies (red and blue represent RCP and LCP, respectively) along with the stellar longitudinal magnetic field (top panel).
A search for counterparts of quiet sun radio transients in extreme ultraviolet data
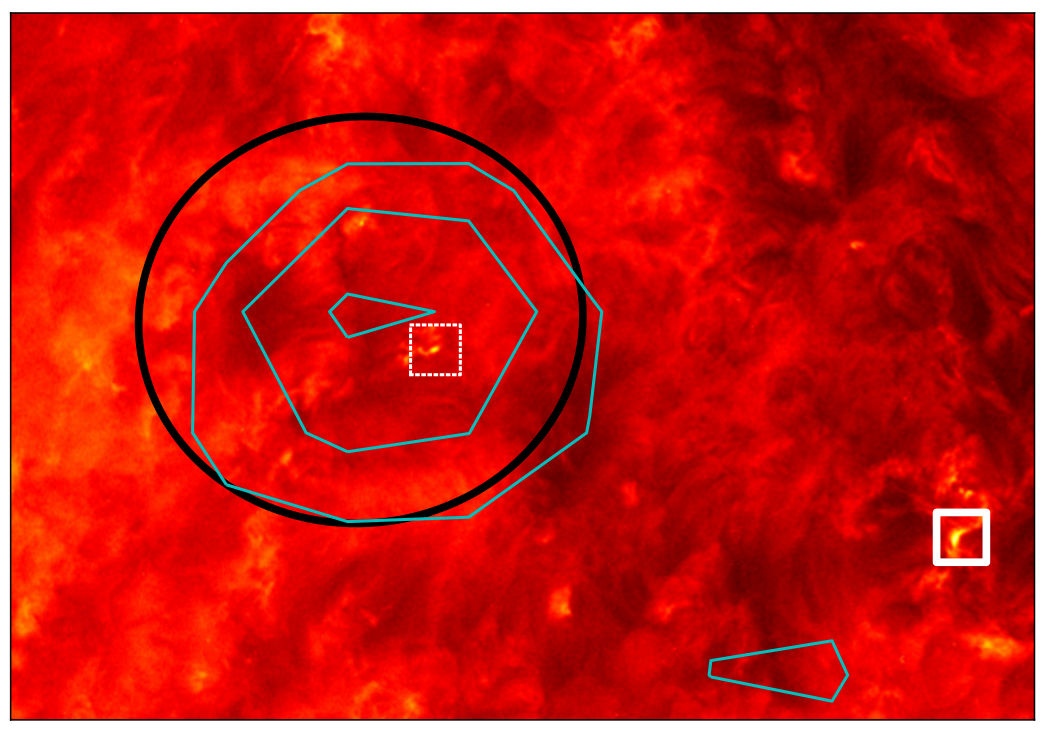
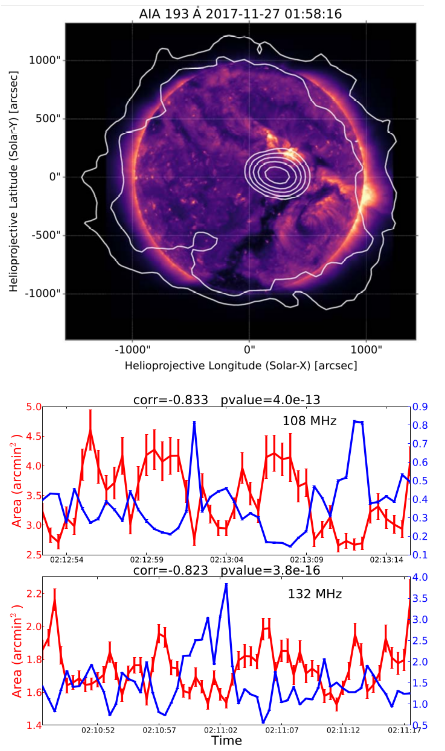
The NCRA solar physics group presented the first firm observational evidence for the presence of ubiquitous impulsive nonthermal radio emissions from the quiet solar corona (Mondal et al., 2020). These have since been christened WINQSEs – Weak Impulsive Narrow-band Quiet Sun Emissions - and are the smoking guns for the weak underlying magnetic reconnection processes or nanoflares which were hypothesised to explain the many decades-old coronal heating problem (Parker, 1988). The quantity of interest, from a coronal heating perspective, is the amount of energy deposited in the corona by the reconnection processes giving rise to these WINQSEs. It is, however, very hard to estimate this energy from radio emissions which arise from non-linear coherent emission processes. On the other hand, such energy estimates are routinely derived using well-established techniques from emissions in the extreme ultraviolet (EUV) and soft X-ray parts of the spectrum, which arise due to thermal processes. Mondal (2021) presents the first attempt to identify the EUV counterparts of these radio transients and use them to estimate the energy deposited into the corona during the events. By a careful comparison of the radio and EUV light curves, the author first identifies the EUV brightening associated with a closely spaced group of WINQSEs and then estimates the flare energy of this brightening to be ~10^25 ergs. The figure shows the radio contours at 132 MHz overlaid on an AIA 171 A map. The two possible EUV brightening candidates are shown in white boxes, with the likely one shown in the solid white box. This is the weakest EUV transient event for which a radio counterpart has been clearly identified. This cluster of WINQSEs had a peak flux density of ~2 mSFU, and the 10^25 ergs estimate is about an order of magnitude larger than nanoflare energies. This work demonstrates that even with current instrumentation, it is possible to identify the EUV counterparts of clusters of WINQSEs, and that the energies involved are consistent with the expectations based on the nanoflare hypothesis, making this an exciting line of exploration.
Insights from Snapshot Spectroscopic Radio Observations of a Weak Type I Solar Noise Storm
Using the data from the Murchison Widefield Array and their pipeline tailored for solar imaging (AIRCARS; Mondal 2019), the NCRA solar physics group has been focusing on studies of weak solar bursts. Here, Mondal and Oberoi present a high-ï¬delity snapshot spectroscopic radio imaging study of a weak type I solar noise storm that took place during an otherwise exceptionally quiet time. The flux density of the noise storm source varied between ∼0.6–24 SFU, about two orders of magnitude weaker than earlier studies along similar lines. The type I radio emission is believed to arise due to electron beams energized during magnetic reconnection activity. They track the observed morphology of the burst source for about 70 minutes to study the details of the reconnection and electron acceleration process during such quiet times. During this time interval, the authors identify multiple instances where the source s integrated flux density and area are strongly anticorrelated with each other. The authors also ï¬nd that the presence of anticorrelation at one frequency does not necessarily imply its presence at other neighbouring frequencies in the same time window. The observed anticorrelation is interpreted as evidence for presence of MHD sausage wave modes in the magnetic loops and strands along which these electron beams are propagating. Their observations suggest that the sites of these small-scale reconnections are distributed along the magnetic flux tube. The authors hypothesize that small scale reconnections produce electron beams which quickly get collisionally damped. Hence, the plasma emission produced by them spans only a narrow bandwidth and the features seen even in neighbouring bands 12 to 28 MHz apart must arise from independent electron beams. These observations suggest a scenario where sausage MHD modes are stochastically excited in quiescent coronal loops. These sausage modes change the density of the non-thermal electrons responsible for the radio emission, thereby producing the observed anticorrelation between the area and the integrated flux density of the noise storm source. The work provides strong evidence that even during very quiescent times, there is discernible magnetic activity in the vicinity of active regions and in coronal loops. It also suggests that MHD oscillations in coronal magnetic loops and strands are likely quite ubiquitous. The radio emission from the weak electron beams propagating through these loops and strands serves to light them up, allowing their detection.
Scintillation of PSR B1508+55 - the view from a 10000-km baseline
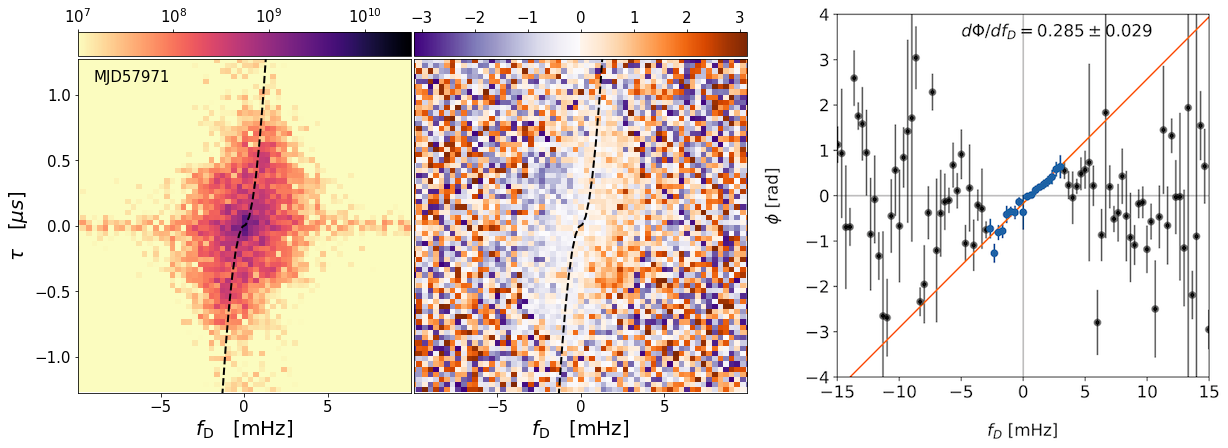
Marthi et al. have measured the speed of the scintillation pattern of PSR B1508+55 on a 10000-km baseline between the GMRT and the Algonquin Radio Observatory (ARO) 46-m telescope. The low cross-correlation coefficient of the scintillation pattern measured at the two telescopes points to the presence of atleast two screens along the line of sight to the pulsar. They use the 45-second delay in the arrival of the scintillation pattern between the telescopes to measure the speed and infer that this scintillation arises from a screen different than seen at the GMRT. The scintillation timescale of 135 second, attributed to the primary scintillation arc seen at the GMRT, is three times longer than the scintillation pattern delay measured on the 10000-km baseline, ruling out both fully isotropic as well as one dimensional scattering, but suggestive of highly anisotropic two dimensional scattering. They hypothesize that the screen causing the primary scintillation arc seen at the GMRT is likely partially resolving the scattering on the screen located further beyond, and that the combined scintillation is responsible for the low cross-correlation seen on the GMRT-ARO baseline. Left: The cross secondary spectrum showing the amplitude and phase gradient across differential Doppler frequency. The amplitude of the cross spectrum normalized by the product of the secondary spectra gives the cross-correlation coefficient of 0.22. Right: The measured phase gradient corresponds to a scintillation delay of ~45 seconds.

Scintillation of PSR B1508+55 - the view from a 10000-km baseline
Marthi et al. have measured the speed of the scintillation pattern of PSR B1508+55 on a 10000-km baseline between the GMRT and the Algonquin Radio Observatory (ARO) 46-m telescope. The low cross-correlation coefficient of the scintillation pattern measured at the two telescopes points to the presence of atleast two screens along the line of sight to the pulsar. They use the 45-second delay in the arrival of the scintillation pattern between the telescopes to measure the speed and infer that this scintillation arises from a screen different than seen at the GMRT. The scintillation timescale of 135 second, attributed to the primary scintillation arc seen at the GMRT, is three times longer than the scintillation pattern delay measured on the 10000-km baseline, ruling out both fully isotropic as well as one dimensional scattering, but suggestive of highly anisotropic two dimensional scattering. They hypothesize that the screen causing the primary scintillation arc seen at the GMRT is likely partially resolving the scattering on the screen located further beyond, and that the combined scintillation is responsible for the low cross-correlation seen on the GMRT-ARO baseline. Left: The cross secondary spectrum showing the amplitude and phase gradient across differential Doppler frequency. The amplitude of the cross spectrum normalized by the product of the secondary spectra gives the cross-correlation coefficient of 0.22. Right: The measured phase gradient corresponds to a scintillation delay of ~45 seconds.
Evaluating Low-frequency Pulsar Observations to Monitor Dispersion with the GMRT
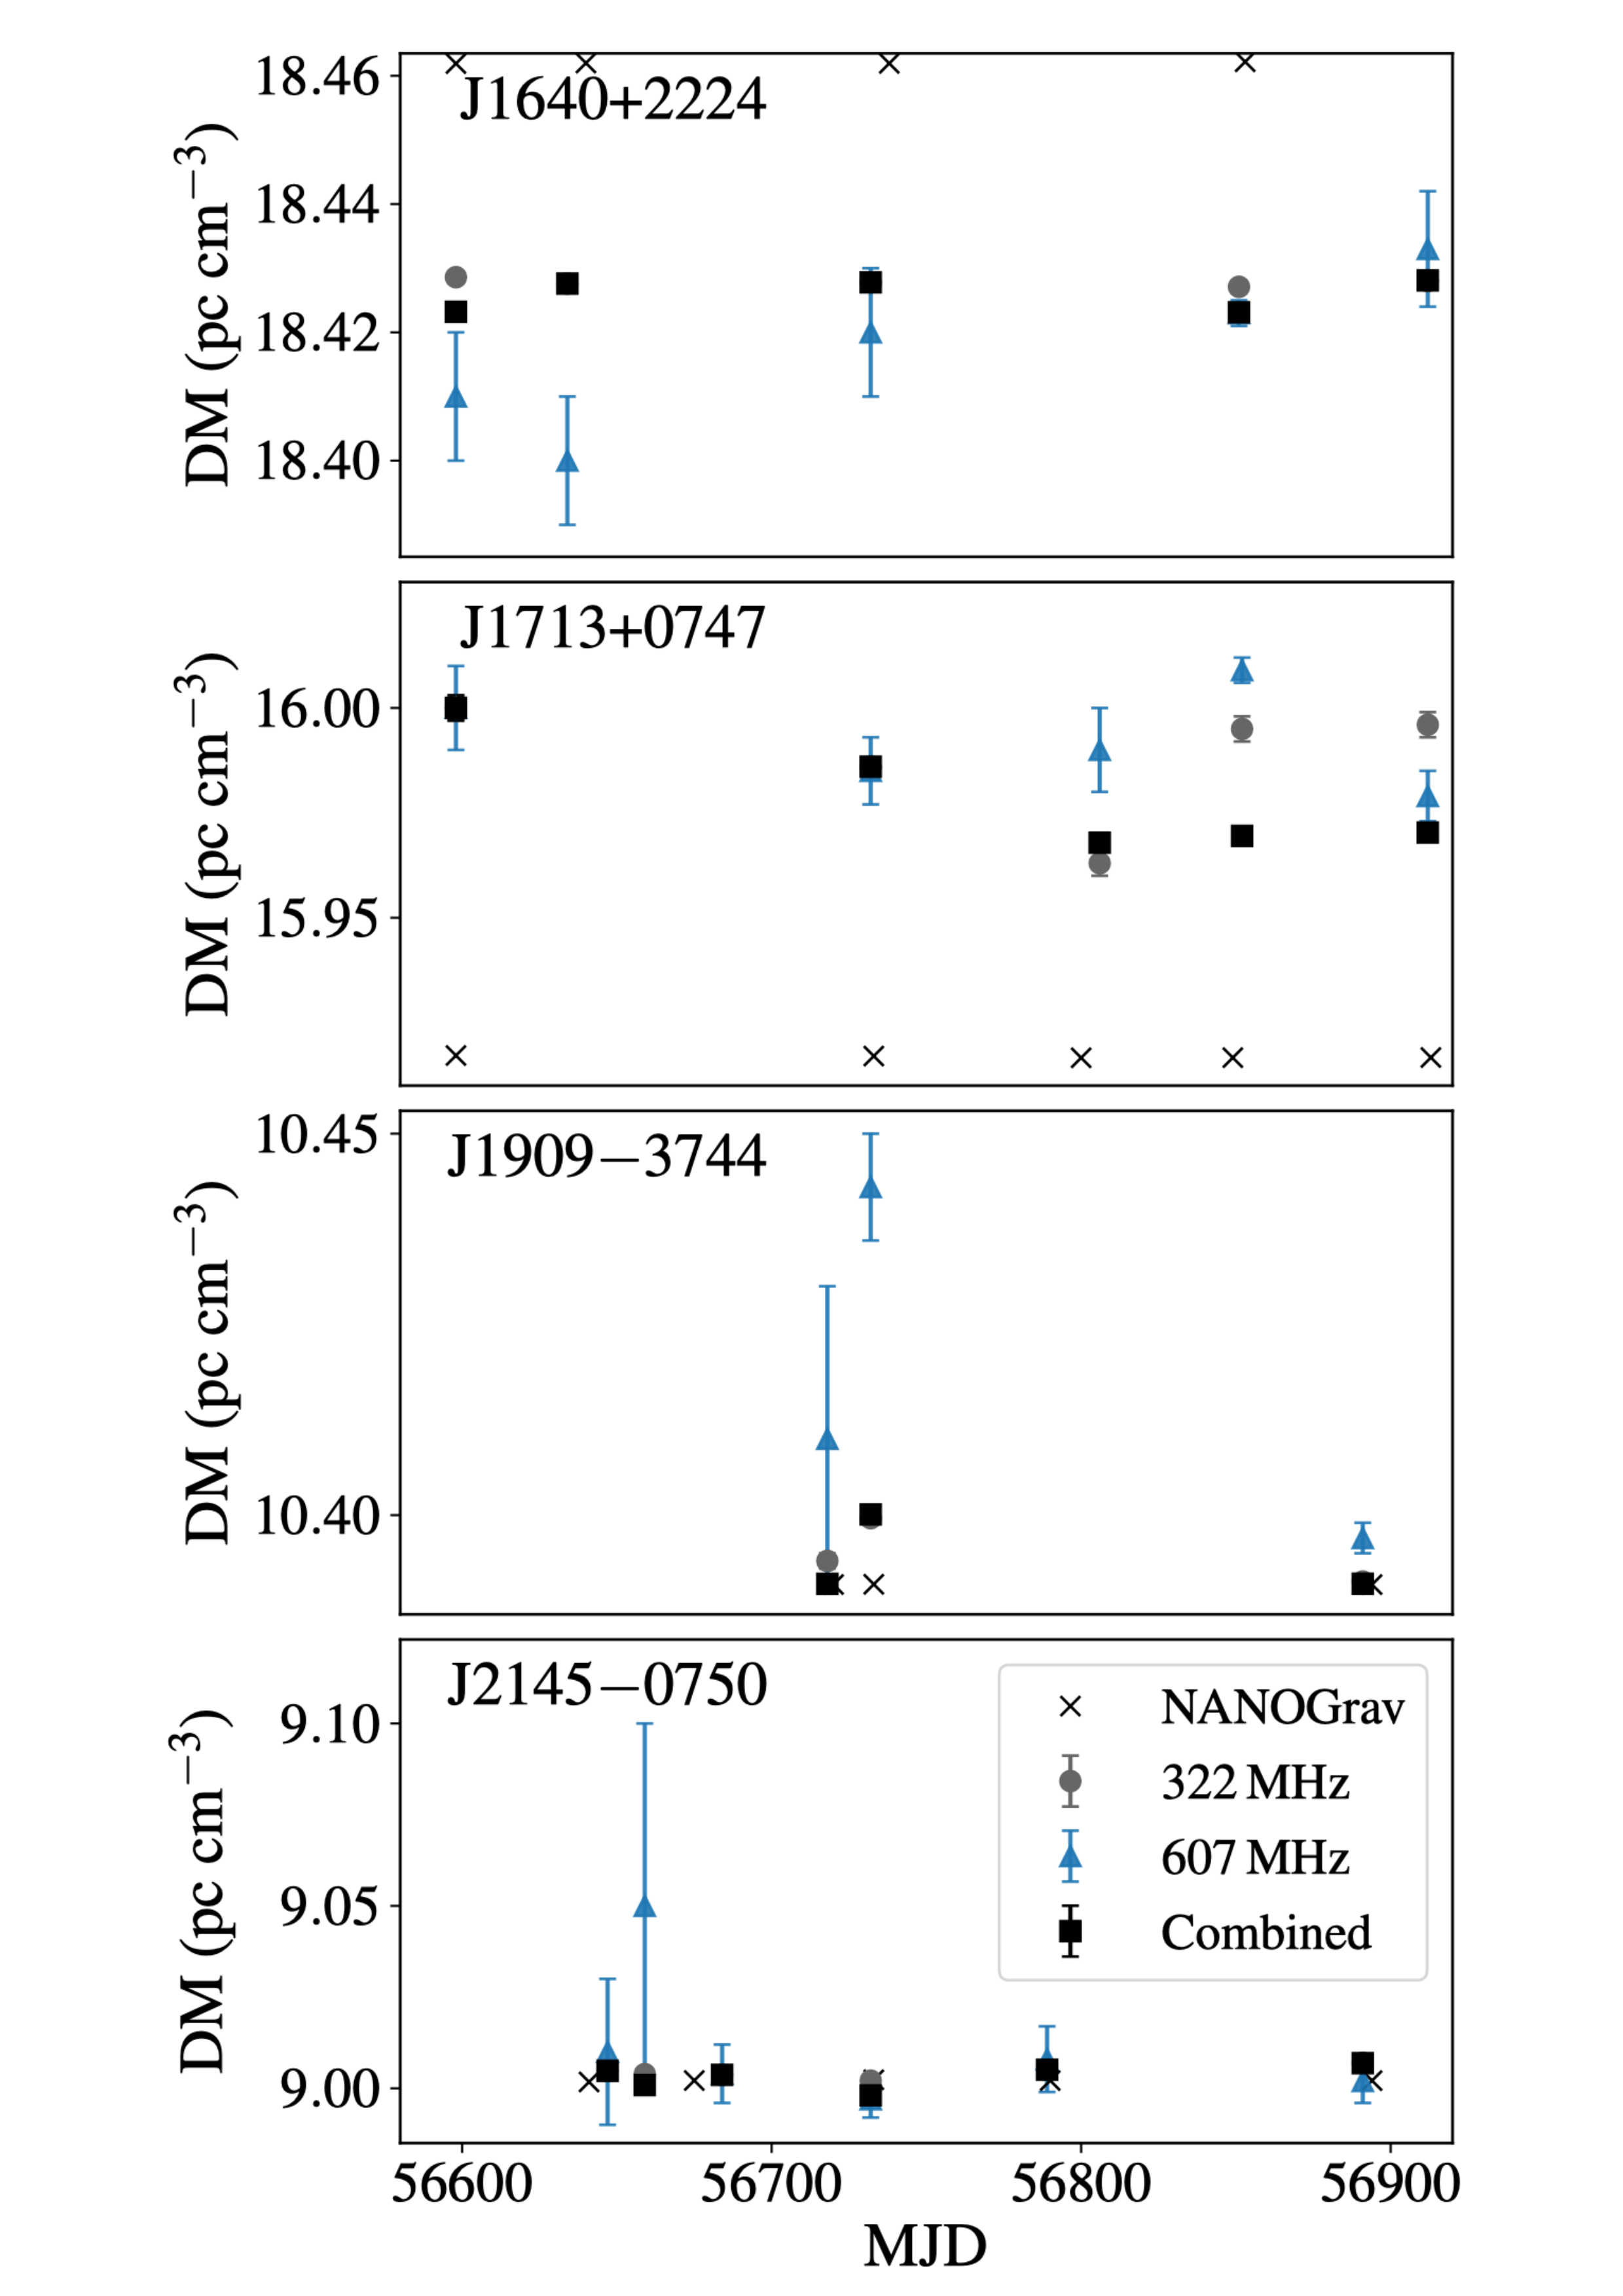
Effects like dispersion and scattering are more influential at lower observing frequencies, with the variation of these quantities over week-month timescales requiring high-cadence multi-frequency observations for pulsar timing projects. The mitigation of such interstellar effects is crucial to achieve the necessary precision for detecting the stochastic Gravitational Waves (GWs) background using a large set of high-timing precision millisecond pulsars (MSPs) distributed across the sky. The primary goal of the Pulsar Timing Array (PTA) is to detect and characterise the low-frequency gravitational waves through high-precision timing. Jones et al. used the low-frequency observing capability of the GMRT and evaluated the potential decrease in dispersion measure (DM) uncertainties when combined with existing pulsar timing array data from the North American Nanohertz Observatory for Gravitational Waves (NANOGrav). They observed four PTA MSPs with the GMRT simultaneously at 322 and 607 MHz, and compared the DM measurements with those obtained through NANOGrav observations with the Green Bank Telescope and Arecibo Observatory at 1400–2300 MHz frequencies. It was shown that incorporation of these low-frequency GMRT data into the NANOGrav data set provides improved DM measurements. Comparison of single-epoch DMs for GMRT and NANOGrav 11-year measurements for the four MSPs, PSRs J1640+2224, J1713+0747, J1909−3744, and J2145−0750 showed the presence of frequency-dependent biases in DM measurements, which could be caused by unmodeled pulse profile evolution. The paper also described the effect of pulse profile baseline ripple on high precision timing of MSPs. Being one of the first attempts to utilize the GMRT for International Pulsar Timing Array (IPTA) work, Jones et al. discussed the challenges of incorporating GMRT data into NANOGrav and IPTA data sets.
GMRT Detection of HI 21 cm Emission from Star-forming Galaxies at z ~ 1.3
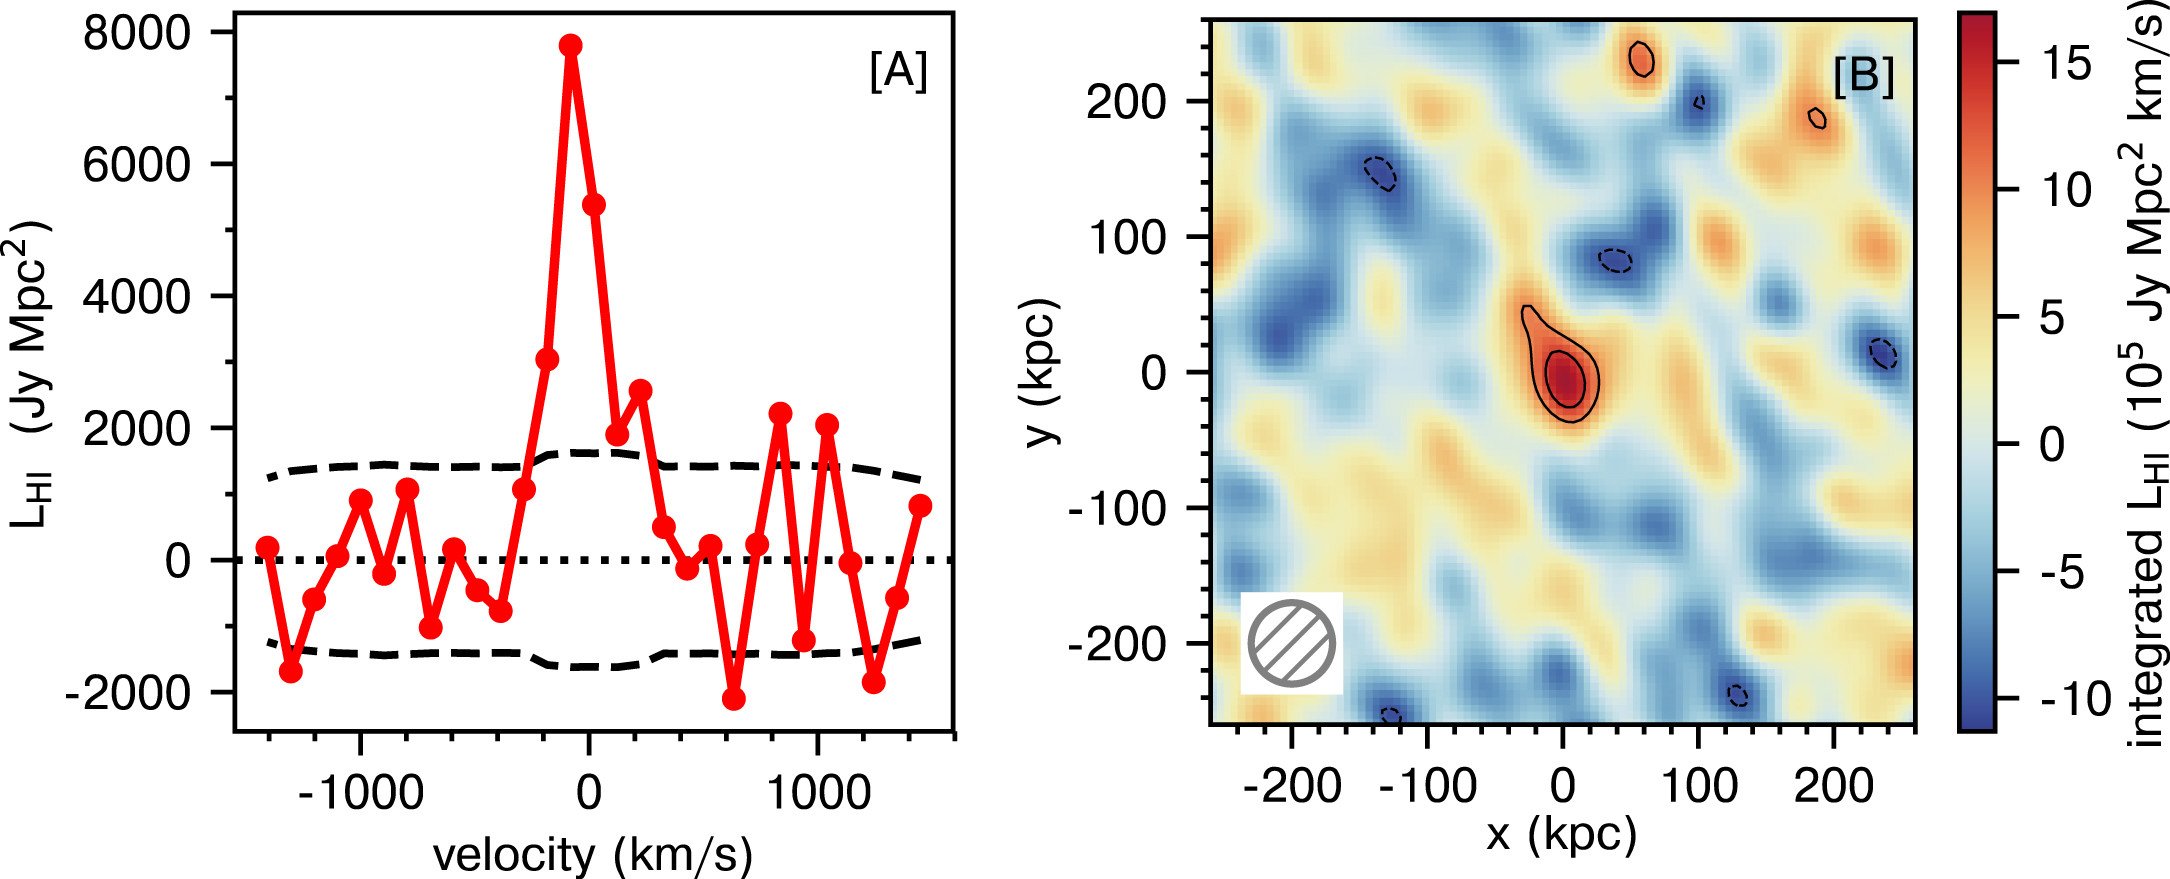
Neutral atomic hydrogen (HI) is a key constituent of galaxies and is the primary fuel for star formation. Therefore, an understanding of galaxy evolution requires measurements of the HI content of galaxies at different cosmological epochs, to probe how the typical HI mass of galaxies changes with time. Unfortunately, the main tracer of HI in galaxies, the hyperfine spectral line at a wavelength of 21.1 cm, referred to as the "recentResults"HI 21cm line, is a very weak spectral line. This makes it very difficult to measure the HI mass of high-redshift galaxies with current radio telescopes, which has severely limited our understanding of critical issues in galaxy evolution. For example, the cosmological star-formation rate density of the Universe is observed to peak in the redshift range z~1-3 (approximately 8-11 billion years ago) and to then decline by a factor of ten to its current value in the local Universe. The cause of the decline is an important open question in galaxy evolution. Chowdhury et al. used approximately 400 hrs of GMRT observations to obtain a detection of the average HI 21cm emission signal from ~2800 star-forming galaxies at z~1.3. Panels [A] and [B] of the figure show the average HI 21cm emission spectrum and the average HI 21cm image, respectively; a detection can be clearly seen in both panels. This is the highest redshift at which the HI 21cm signal has so far been detected, coming from galaxies 9 billion years ago. The authors used the detection of the average HI 21cm emission to estimate the average HI mass of star-forming galaxies at z~1.3: they find that the average HI mass of galaxies at this epoch is roughly 2.5 times higher than the average mass in stars. This is very different from galaxies in the local Universe where the HI mass is typically less than half the stellar mass. However, the high-z galaxies also have very high star-formation rates; the authors combine the star-formation rates with the measured average HI mass to find that the atomic gas can fuel the star-formation activity for only around 2 billion years, without replenshment of the gas reservoir. This is much shorter than the timescale on which HI is consumed by galaxies in the local Universe. This indicates that a lack of HI fuel to maintain the high star-formation rate of galaxies at these redshifts is the likely cause of the observed decline in the cosmic star-formation activity at z<1. The new results extend to higher redshifts the group’s earlier detection of the average HI 21cm signal, from galaxies at z~1.0, i.e. roughly 8 billion years ago. Also, the two studies were carried out with different receivers and electronics signal chain: the current result used the original GMRT receivers and electronics, while Chowdhury et al. (2020) used the upgraded GMRT receivers and electronics. The new results are thus an important independent confirmation of the results of the earlier study.
The Atomic Gas Mass of Green Pea Galaxies
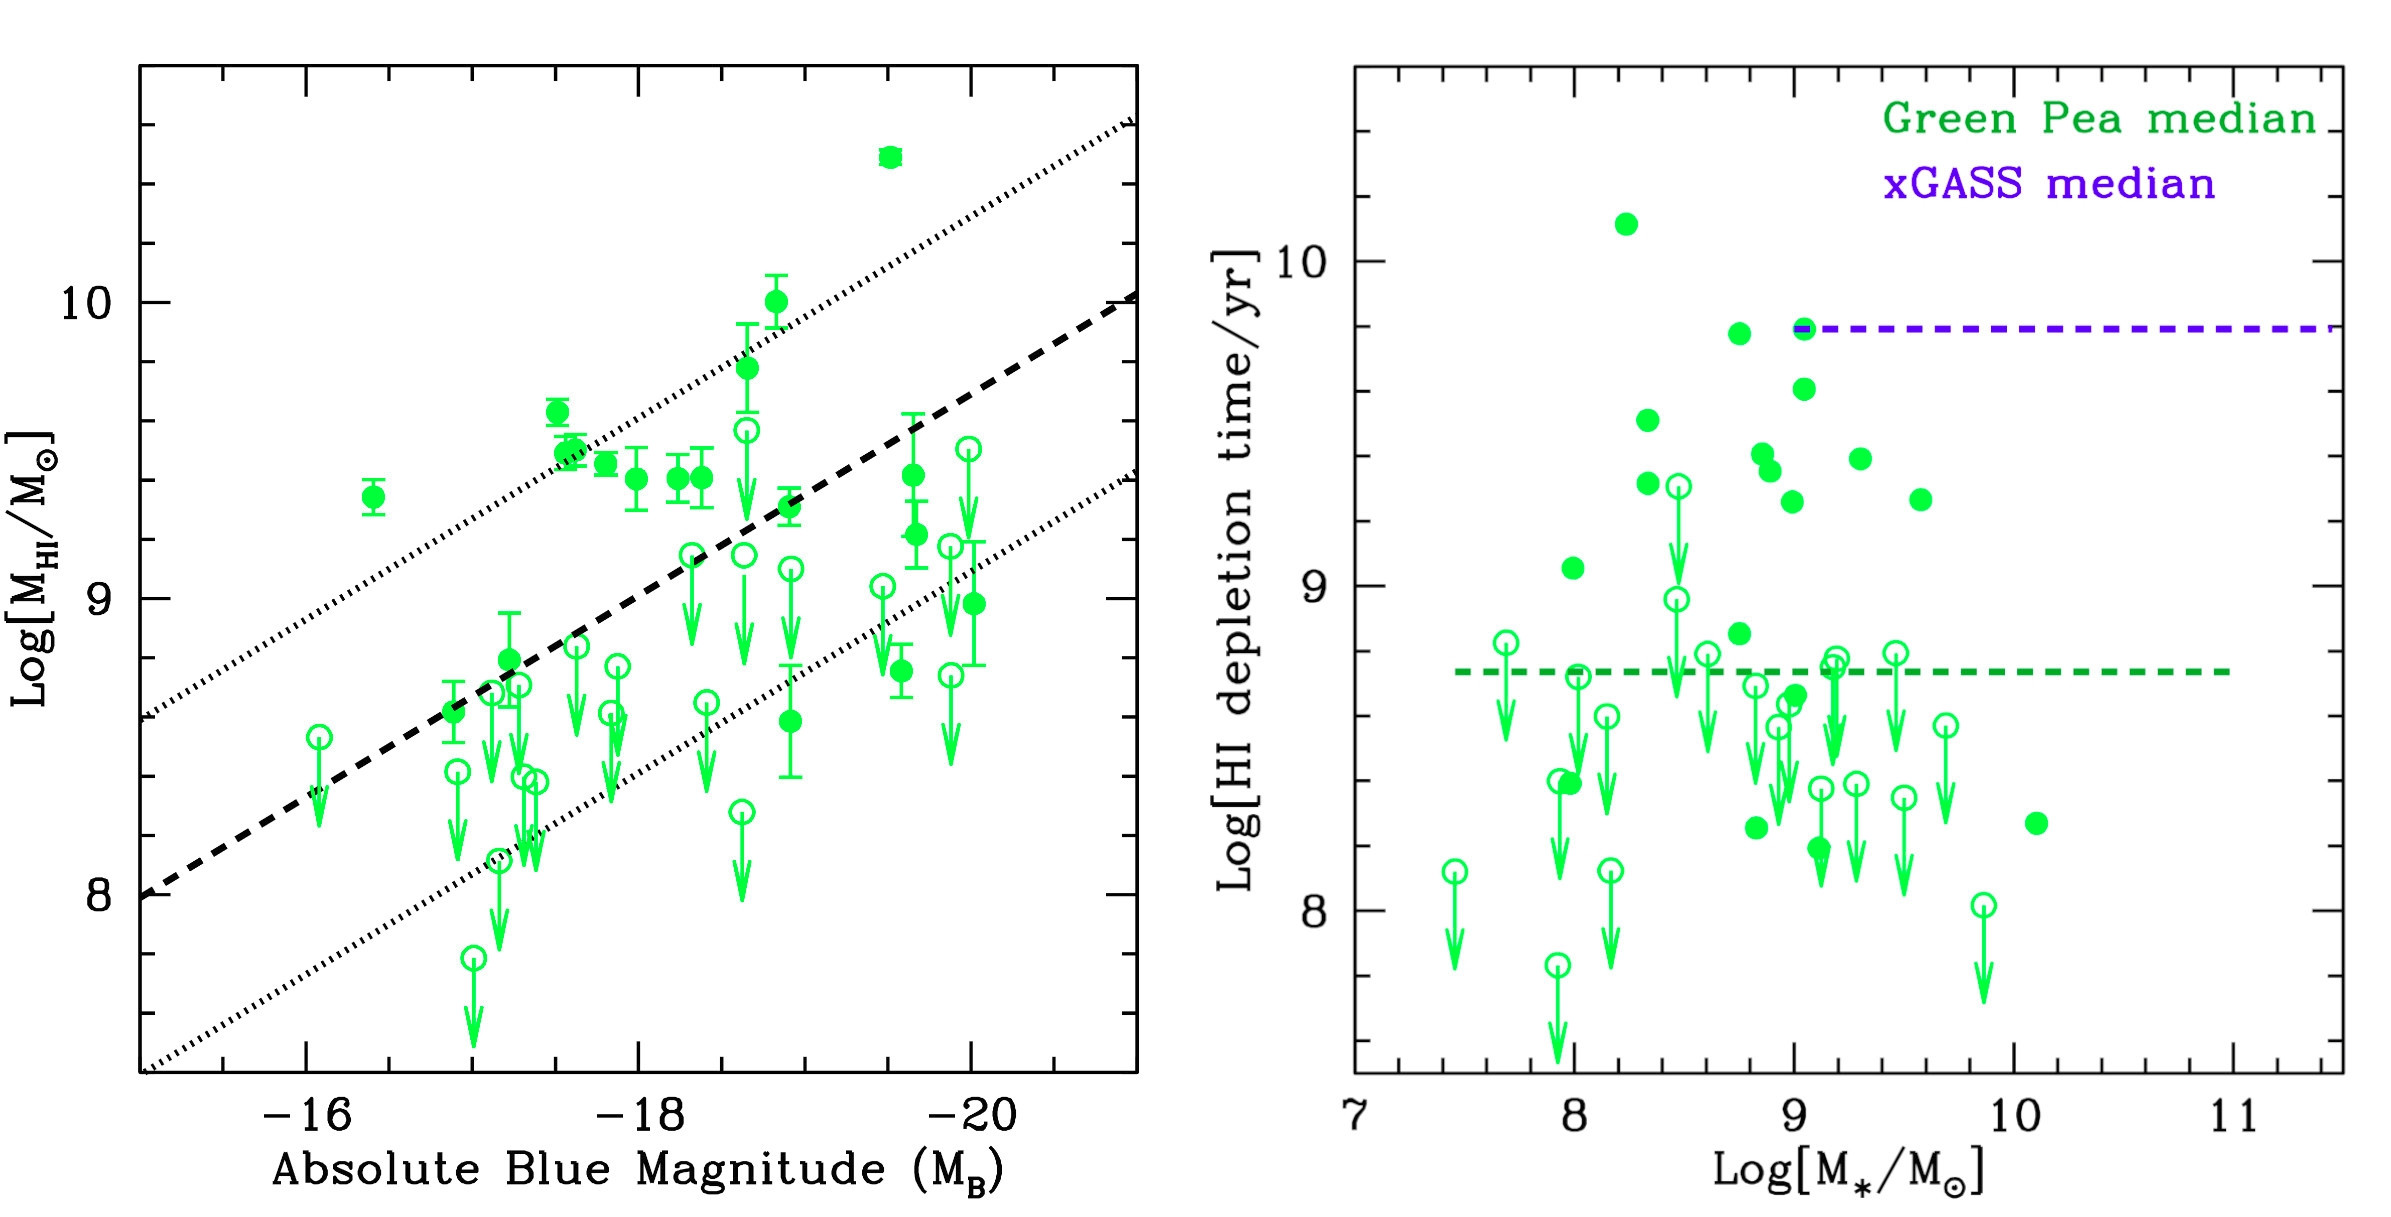
Green Pea galaxies are extreme emission-line galaxies at low redshift, with low metallicity and dust content, strong nebular lines, compact or interacting morphology, and intense star formation activity, and which often show leakage of Lyman-continuum radiation. Green Peas are believed to be the best local analogs of the galaxies that drove cosmological reionization at z>6, and offer the exciting possibility of understanding conditions in the high-redshift galaxies by detailed studies of nearby objects. However, while detailed optical and UV imaging and spectroscopic studies have characterized the stellar, nebular and star-formation properties of Green Peas, little was hitherto known about the primary fuel for star-formation in these galaxies, the neutral atomic hydrogen (HI). As such, the cause of the intense starburst activity in the Green Peas was unclear. Kanekar et al. used the Arecibo Telescope and the Green Bank Telescope to carry out a deep search for HI 21cm emission from a large sample of Green peas, obtaining detections of HI 21cm detections and estimates of the HI mass in 19 galaxies, and strong upper limits on the HI mass in 21 systems. These are the first estimates of the atomic gas content of Green Pea galaxies. Kanekar et al. find that the HI-to-stellar mass ratio in Green Peas is consistent with trends identified in star-forming galaxies in the local Universe. However, the median HI depletion timescale in Green Peas is more than ten times lower than that obtained in local star-forming galaxies. This implies that Green Peas consume their atomic gas on very short timescales. Kanekar et al. also find evidence of bimodality in the Green Pea sample, with many Green Peas appearing gas-rich, suggesting recent gas accretion, and others appearing gas-poor, suggesting that all their atomic hydrogen has been eaten by star-formation. The left panel of the figure shows the HI mass of the Green Peas plotted against their optical B-band absolute magnitude (equivalent to their B-band luminosity); the solid line shows the relation between HI mass and B-band magnitude seen in normal galaxies in the local Universe, with the two dashed lines showing the spread around the relation. A number of Green Peas are seen to lie above and below the spread in the relation, indicating that some Green Peas have a higher HI mass than expected (i.e. are gas-rich), while others have a lower HI mass than expected (i.e. are gas-poor). The right panel shows the timescale on which the HI in the Green Peas would be consumed by star formation (green circles) plotted against their stellar mass. The dashed green line shows the median HI depletion timescale in the Green Pea sample, approximately 600 million years. The dashed blue line shows the median HI depletion timescale for the xGASS sample of normal nearby galaxies; this is seen to be a factor of 10 higher than that in the Green Peas. Note that both plots are in logarithmic units: a change by 1 unit corresponds to a factor of 10!
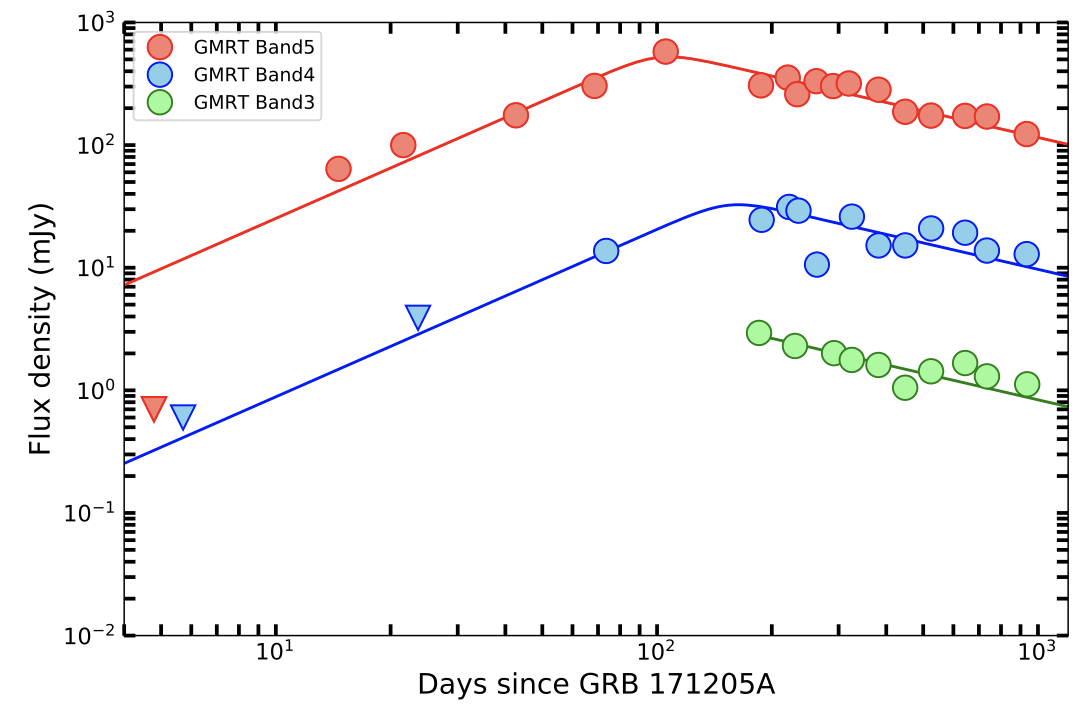
Three years of observations of low luminosity GRB 171205A
Maity & Chandra carried out the lowest-frequency measurements of gamma-ray burst (GRB) 171205A with the upgraded Giant Metrewave Radio Telescope (uGMRT), covering a frequency range of 250-1450 MHz and a period of upto 1000 days. This is the first GRB afterglow detected in the 250-500 MHz frequency range and the second brightest GRB detected with the uGMRT. Even though the GRB was observed for nearly 1000 days, there is no evidence of a transition to the non-relativistic regime. The data are fit with a synchrotron afterglow emission arising from a relativistic, isotropic, self-similar deceleration as well as from a shock breakout of a wide-angle cocoon. The authors were able to discern the nature and the density of the circumburst medium, finding that the GRB is likely to have exploded in a stratified wind-like medium. Their analysis suggests that the radio afterglow has a contribution from two components: a weak, possibly slightly off-axis jet and a surrounding wider cocoon, consistent with earlier results. The cocoon emission is likely to dominate at early epochs, whereas the jet starts to dominate at later epochs, resulting in flatter radio light curves. The figure shows the uGMRT Band-5, Band-4 and Band-33 radio light curves, with the Band-4 and Band-5 values scaled by factors of 10 and 100, respectively. The data are best fit with pre- and post peak spectral indices of 1.37 +/- 0.20 and -0.72 +/- 0.06.