Science Highlights
The Gas Accretion Rate of Galaxies over z~0-1.3
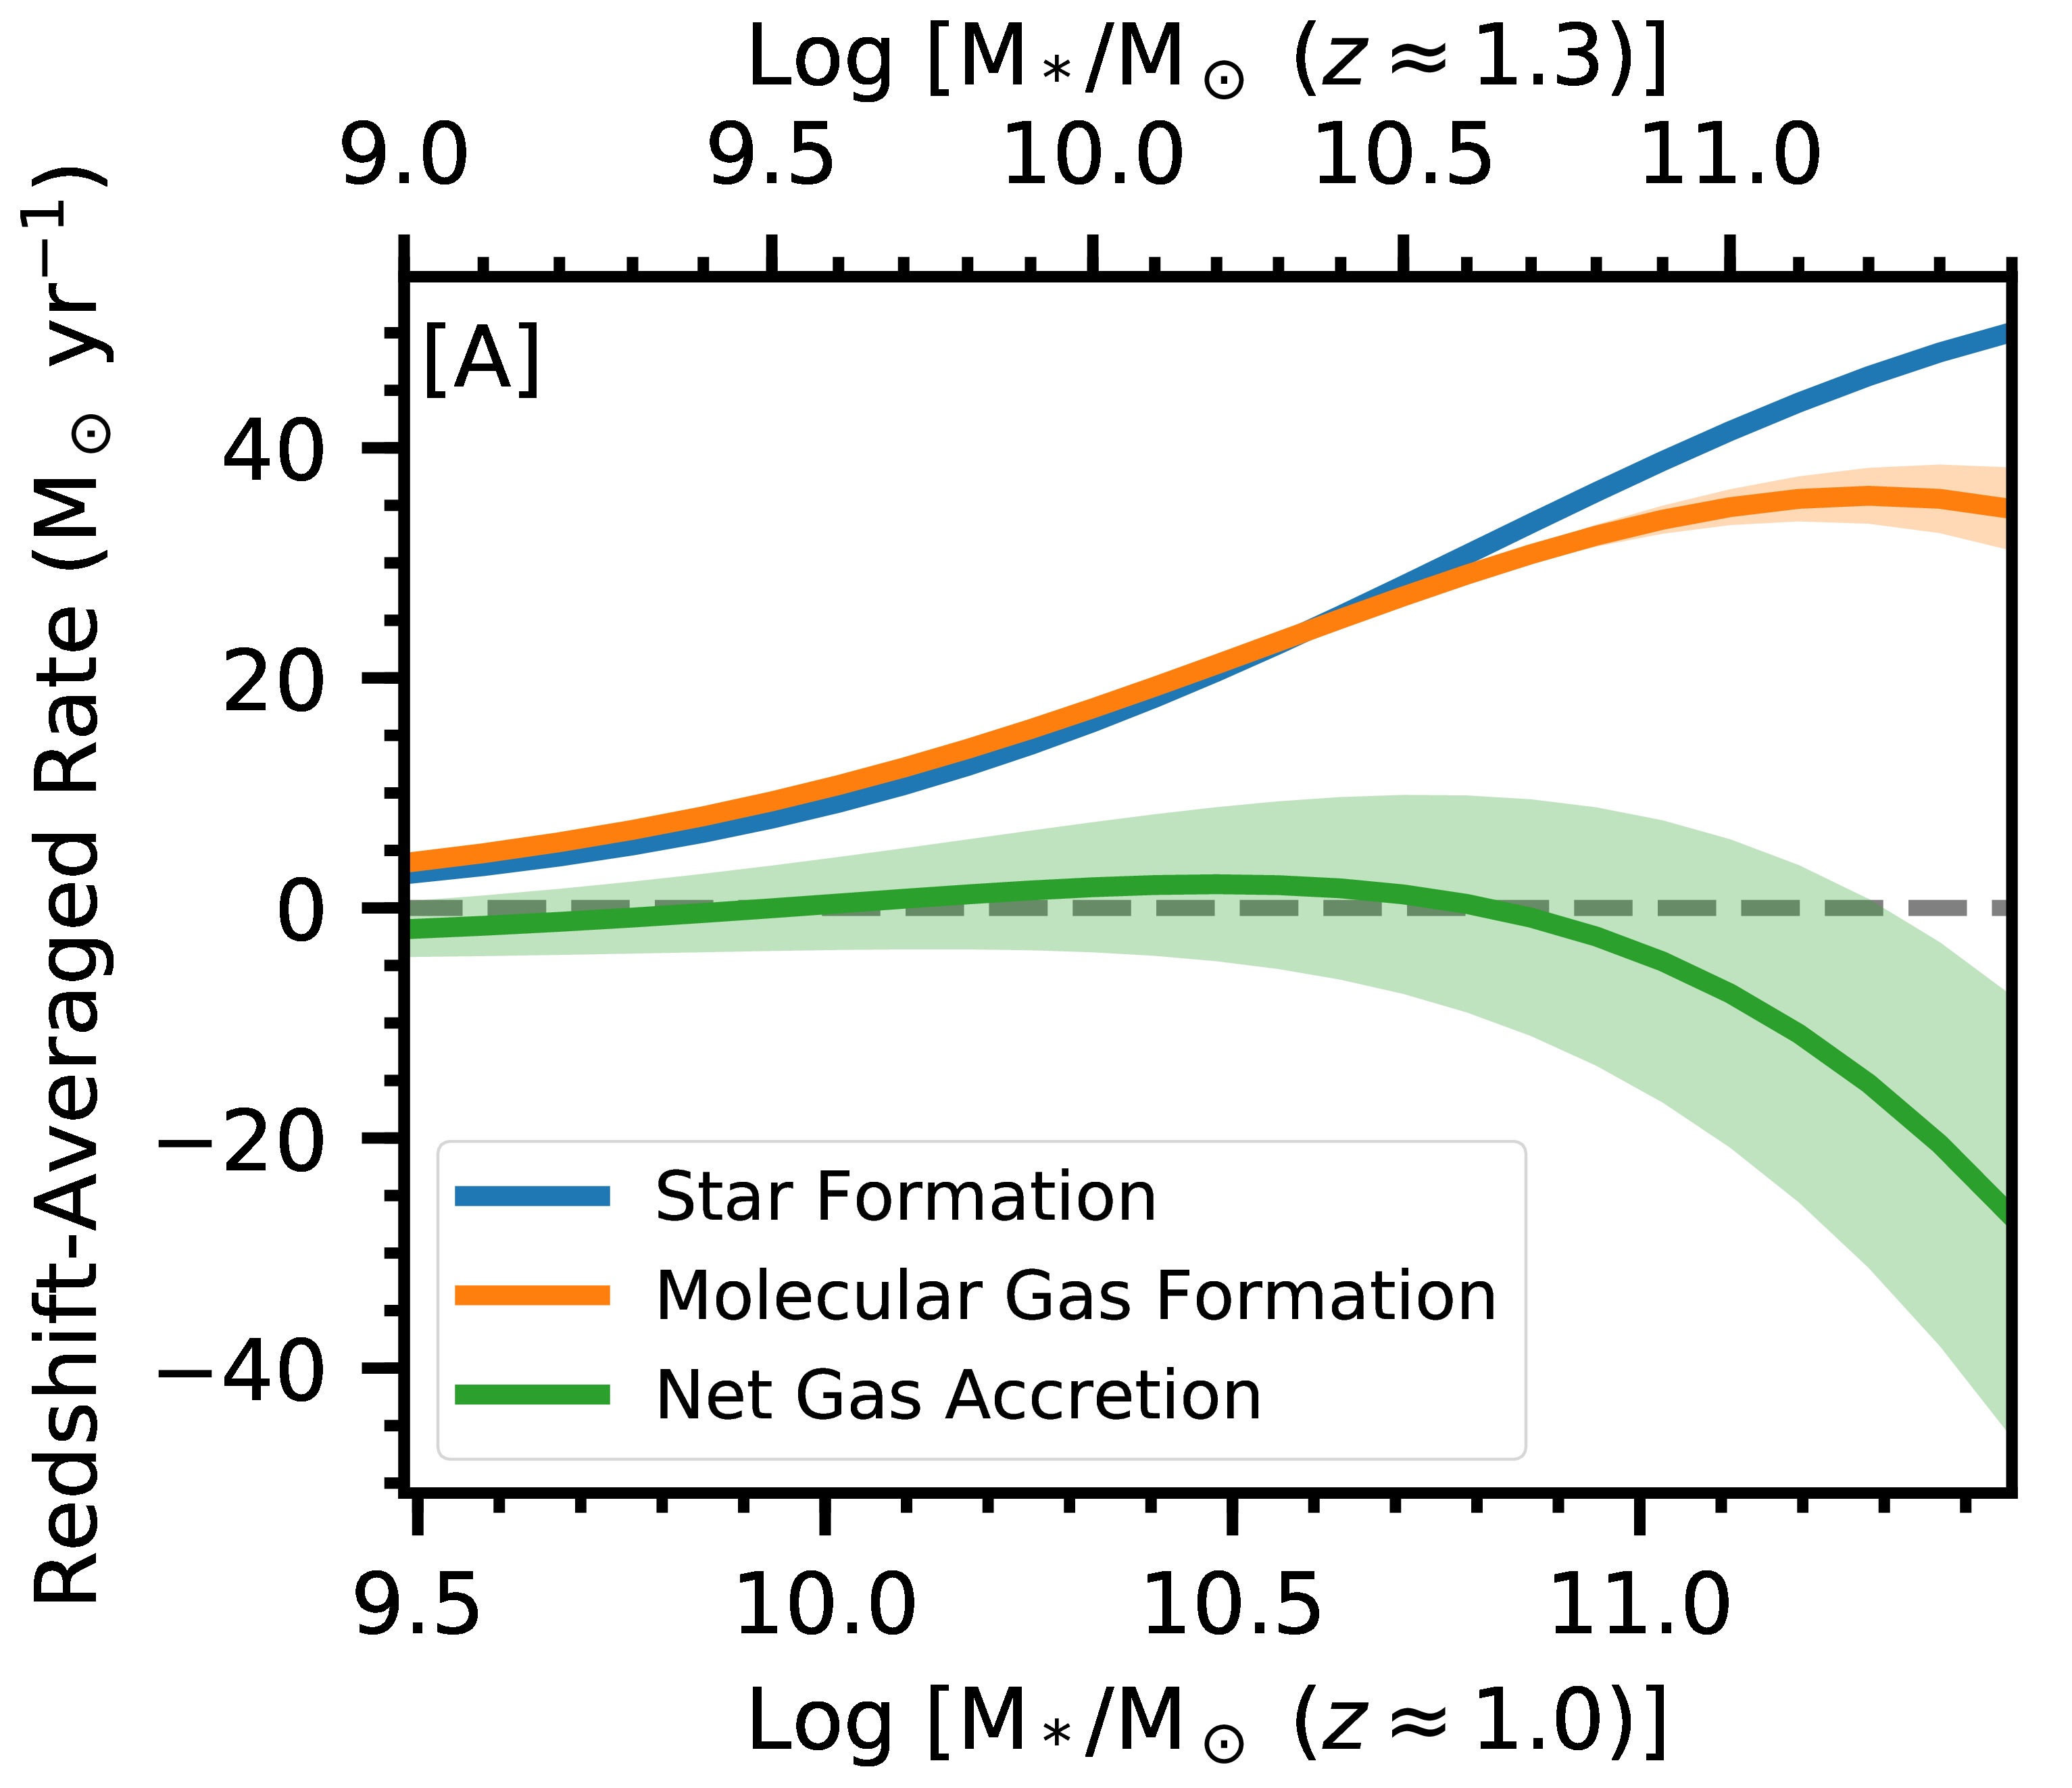
A galaxy’s evolution is driven by processes that regulate its key baryonic constituents, the neutral atomic gas (HI), the molecular gas (H2), and the stars. These processes can be quantified by three key rates: (i) the net rate of accretion of HI from the circumgalactic medium (CGM) that surrounds the disk of the galaxy, (ii) the formation rate of H2 from HI, and (iii) the star-formation rate (SFR). While the evolution of the SFR density of the Universe with cosmological time has been known for over two decades now, the difficulty of measuring the HI content in distant galaxies has meant that there is so far no estimate of the gas accretion rate or its evolution at z~1. Chowdhury et al. used their recent measurement of the HI content of galaxies at z~1 (8 Gyr ago) from the GMRT- CATz1 survey to estimate the average rates of accretion of HI onto galaxies at two key epochs in galaxy evolution: (i) z ~ 1.3–1.0 (9 to 8 Gyr ago), toward the end of the epoch of peak star formation activity in the Universe, and (ii) z ~ 1–0 (8 Gyr to today), when the star formation activity of the Universe declines by an order of magnitude. The figure shows, for galaxies at the earlier epoch (z~1.3–1.0), as a function of their stellar masses, the time-averaged net gas accretion rate (in green), the H2 formation rate (in orange), and the average star-formation rate (in blue). The figure demonstrates that, for galaxies at the early epoch, between 8 to 9 Gyr ago, the average gas accretion rate is far lower than the average SFR, but the H2 formation rate is comparable to the average SFR. Conversely, the authors find that, at later times (8 Gyr ago to today, not shown in the figure), both the accretion rate and the H2 formation rate are significantly lower than the average SFR. Chowdhury et al. also show that massive galaxies had already acquired most of their present-day baryonic mass 9 Gyr ago. Overall, the results show that the rapid conversion of the existing atomic gas reservoir to molecular gas was sufficient to maintain a high average SFR in galaxies 8-9 Gyr ago, despite the low net gas accretion rate. However, at later times, the combination of the lower net gas accretion rate and the lower H2 formation rate leads to a decline in the fuel available for star formation and results in the observed decrease in the SFR density of the Universe over the last 8 Gyr.
Single pulse polarization study of pulsars B0950+08 and B1642−03: micropulse properties and mixing of orthogonal modes
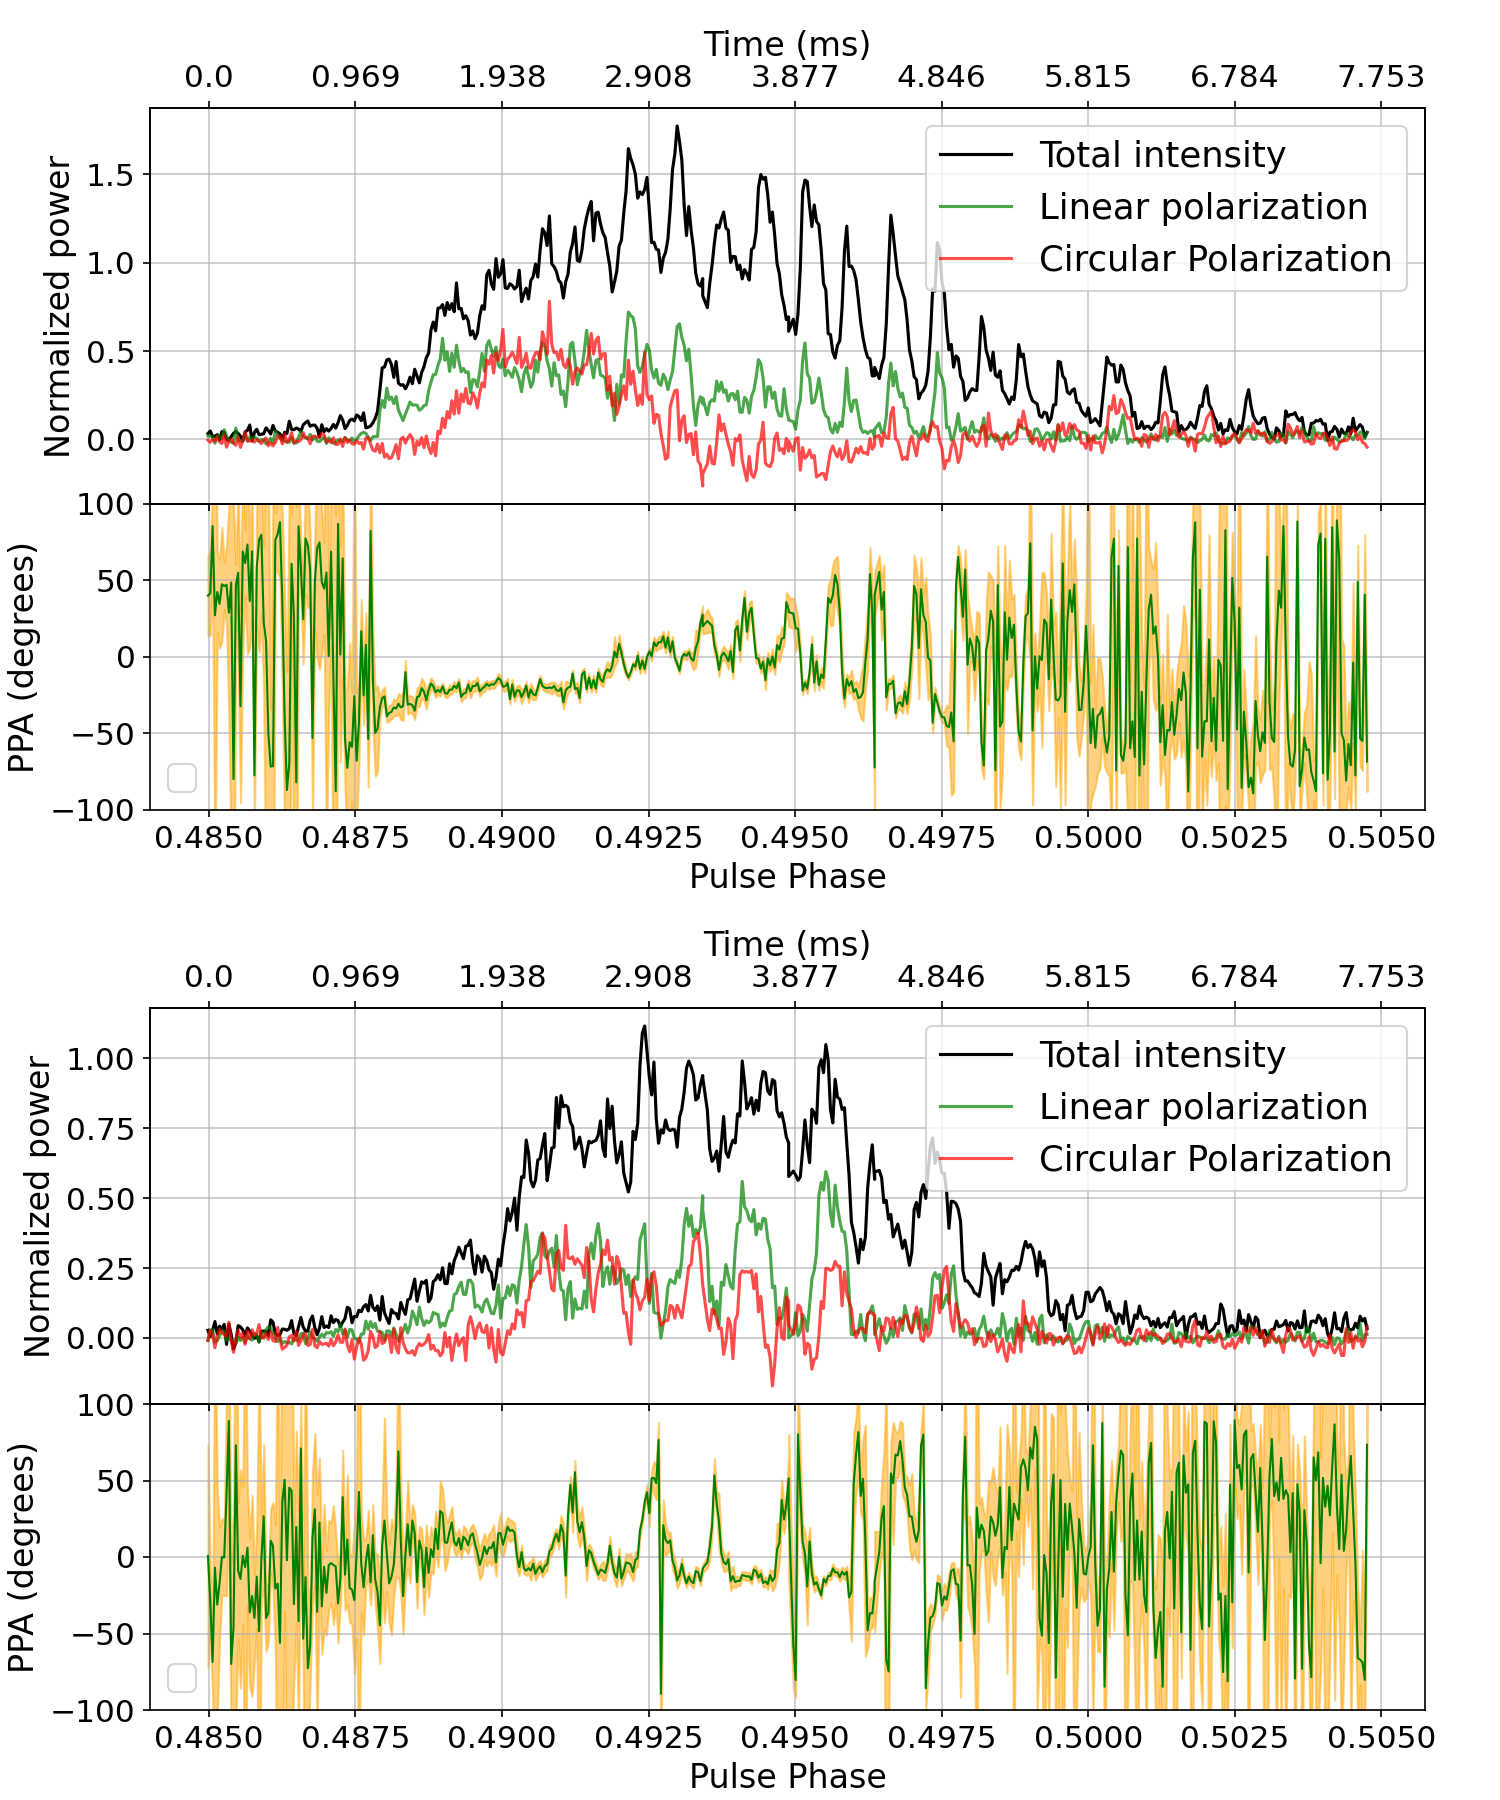
The pulsed radio emission from pulsars and their rotational properties (e.g., period, slow-down rate, etc) are the primary observables to understand the pulsar radio emission. The radio signal from pulsars is known to be significantly polarized and this polarization varies from pulse to pulse, but a stable polarization profile can be obtained after folding a few hundred pulses. The polarization properties of single pulses from pulsars reveal various interesting properties such as depolarization and orthogonal mode jumps, potentially carrying major clues about the physical processes responsible for pulsar radio emission. Similarly, fine structures in the single pulses, also known as microstructures, are thought to be fundamental units of pulsar radio emission. To better understand the single pulse properties of pulsars and the origin of microstructures, Singh et al. performed a high-time-resolution polarization study of two bright pulsars, B0950+08 and B1642-03, with the GMRT. They find that pulsar B0950+08 occasionally shows microstructures without significant underlying subpulse emission. These micropulses were labeled as intrinsic micropulses and were utilized to study the true nature of micropulse emission. These intrinsic micropulses show common trends in their polarization properties, including high linear polarization (~80%), the same sign of circular polarization, and position angle strictly following the position angle track of the folded profile. Using the circular polarization of these intrinsic micropulses, the authors argue against the vacuum curvature radiation by a point charge as the origin of micropulse emission. The paper also reports the micropulse width statistics from pulsars B1642-03 and B0950+08. The authors notice many cases of position angle mode changes caused by the presence of overlap between two subpulses or subpulse and micropulses (the figure shows the cases of subpulse and micropulse overlap from pulsar B1642-03). The authors propose simple superposition models of the two possible orthogonal modes to explain these position angle transitions.
The Gas Accretion Rate of Star-forming Galaxies over the last 4 Gyr
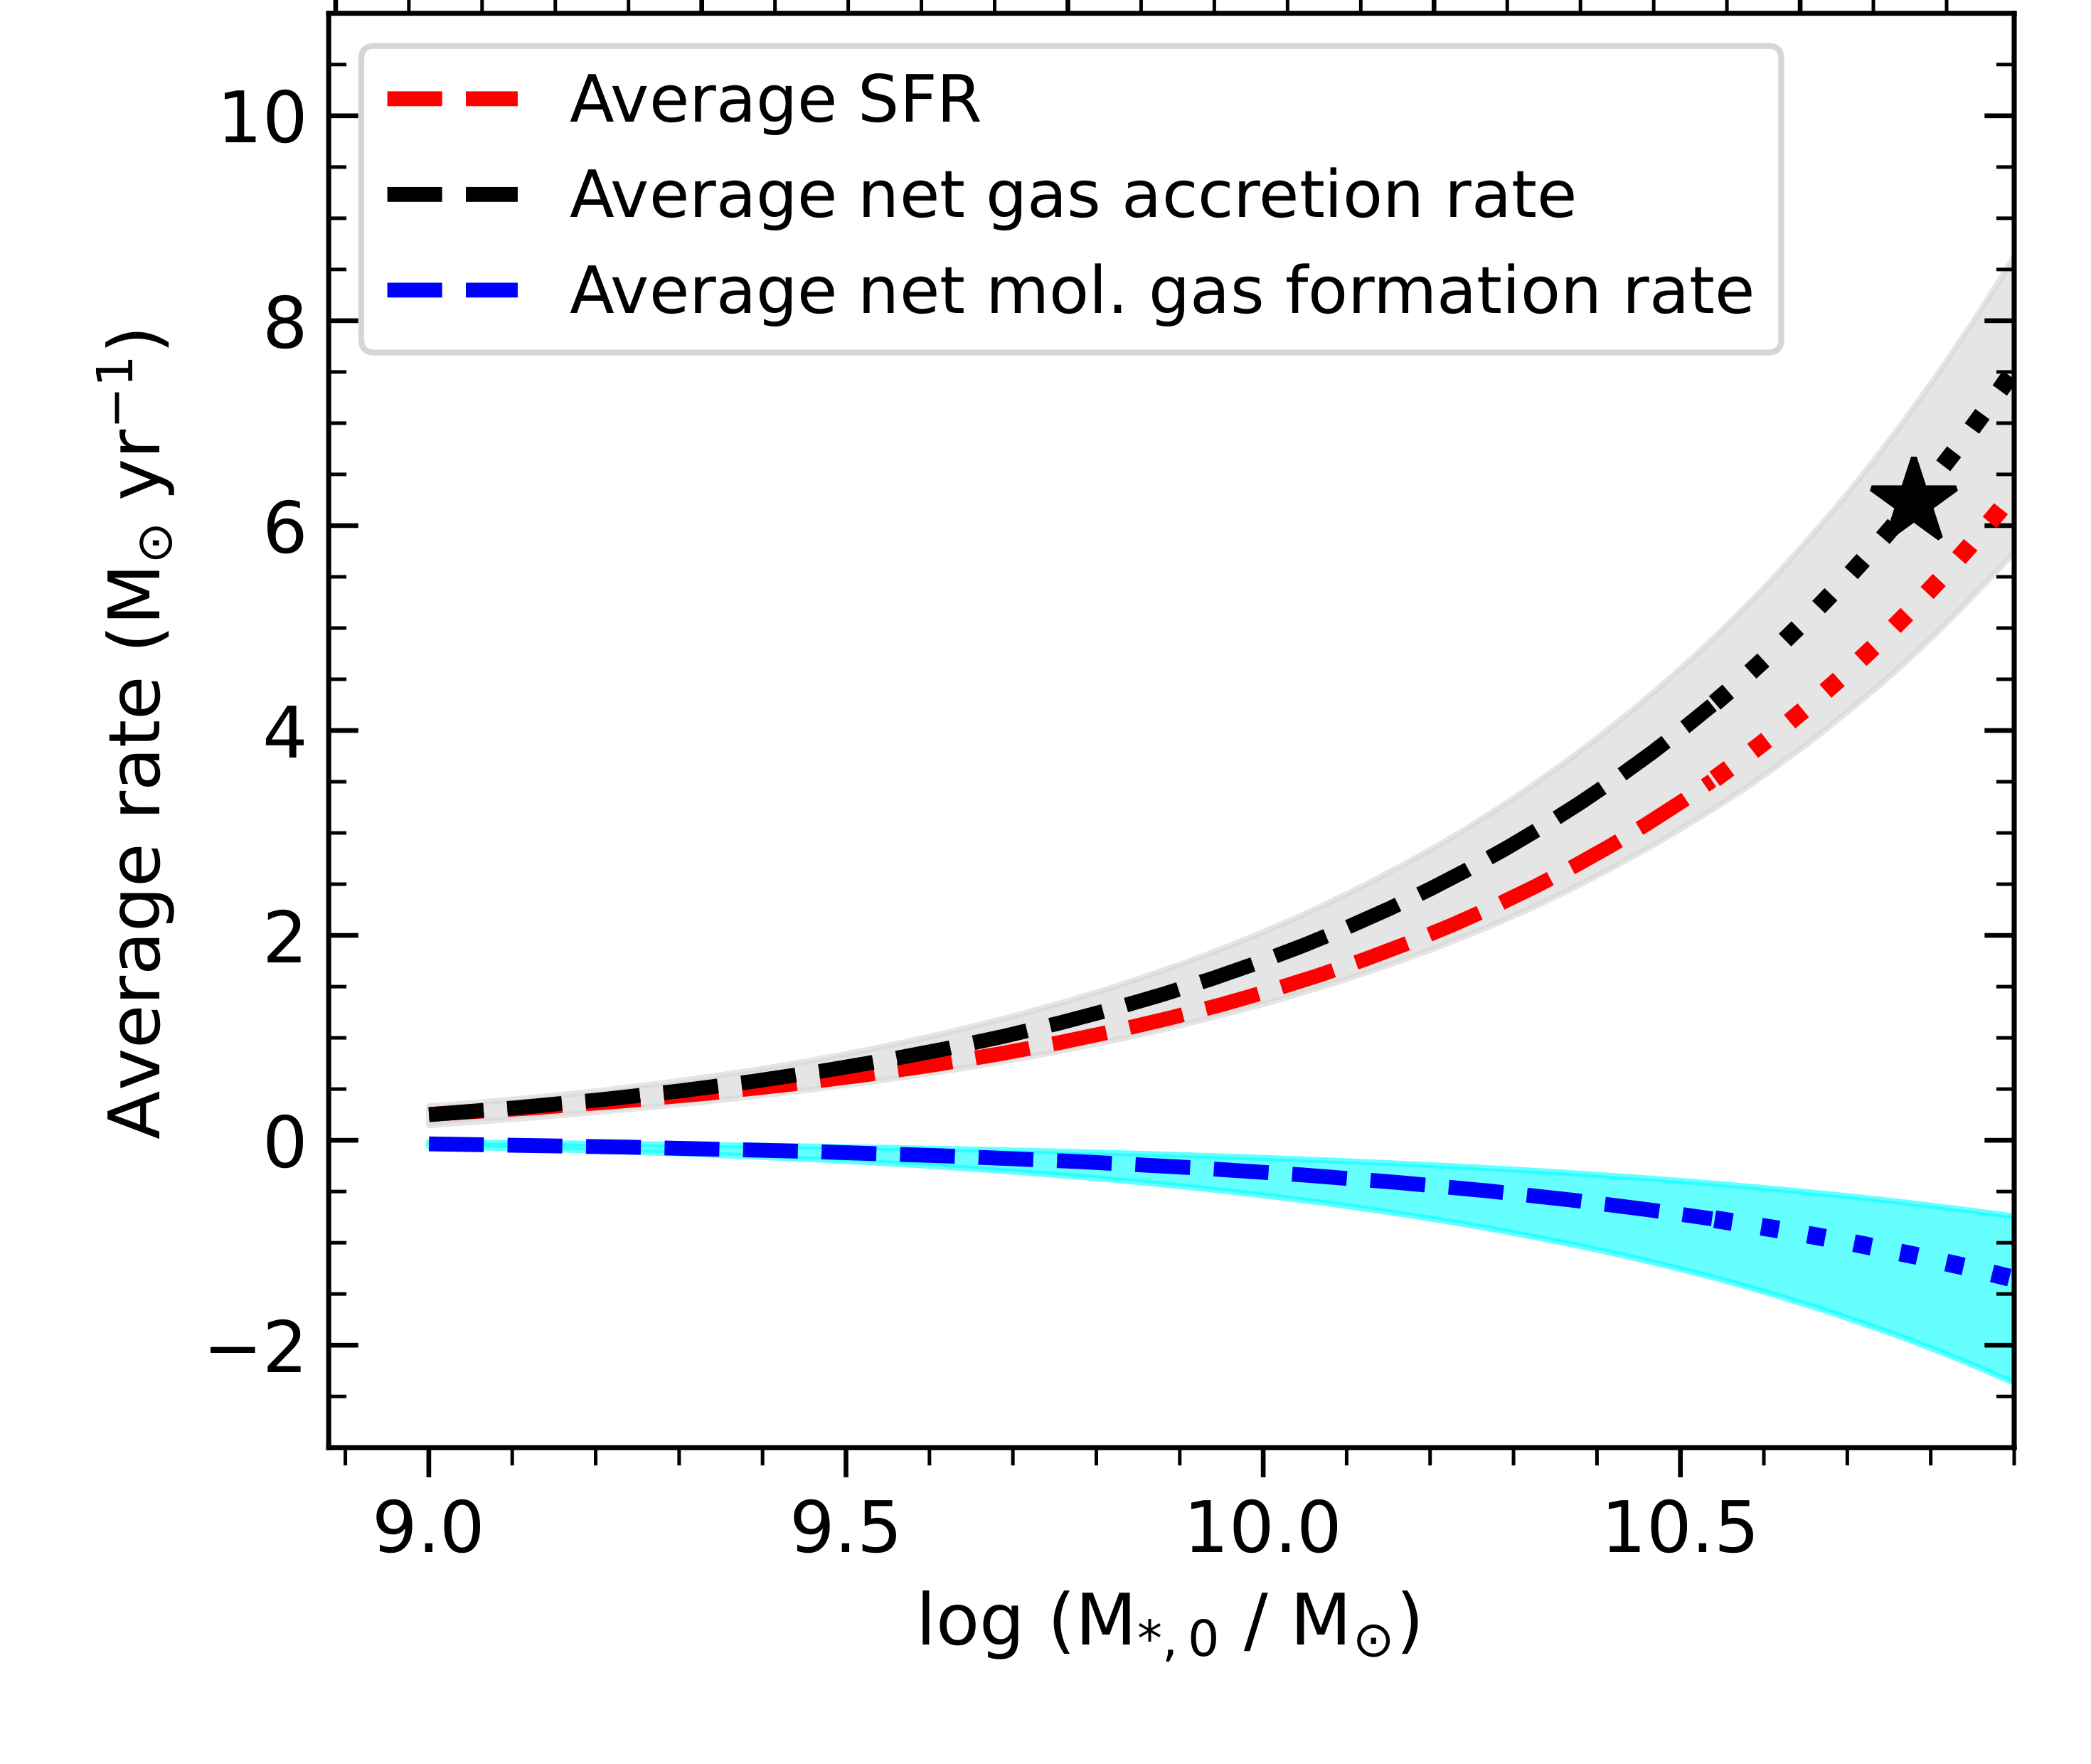
Star-forming galaxies are believed to replenish their atomic gas reservoir, which is consumed in star-formation, through accretion of gas from the circumgalactic medium (CGM). However, there are few observational constraints today on the gas accretion rate in external galaxies. Bera et al. used the recent upgraded GMRT measurement of the scaling relation between the atomic hydrogen (HI) mass and the stellar mass in star-forming galaxies at z~0.35, with the relations between the star-formation rate and stellar mass, and between the molecular gas mass and stellar mass, to determine the evolution of the neutral gas reservoir and the average net gas accretion rate onto the disks of star-forming galaxies over the past 4 Gyr. They found that for galaxies with present day stellar masses exceeding a billion solar mass, both stellar mass and HI mass in the disk have increased, while the molecular gas mass has decreased, since z~0.35. The average gas accretion rate onto the disk over the past 4 Gyr is similar to the average star-formation rate over this period, implying that star-forming galaxies have maintained a stable atomic gas reservoir, despite the consumption of gas in star-formation. The figure shows the estimates of the average star-formation rate (red line), the average net gas accretion rate (black line) and the average net molecular gas formation rate (blue line) of star-forming galaxies over the past 4 Gyr against their present day stellar mass. Bera et al. also estimated an average net gas accretion rate (over the past 4 Gyr) of about 6 solar masses per year for galaxies with the stellar mass of the Milky Way. They concluded that at low redshifts, z<~0.4, the reason for the decline in the cosmic star-formation rate density is likely to be the inefficiency in the conversion of atomic gas to molecular gas, rather than insufficient gas accretion from the CGM.
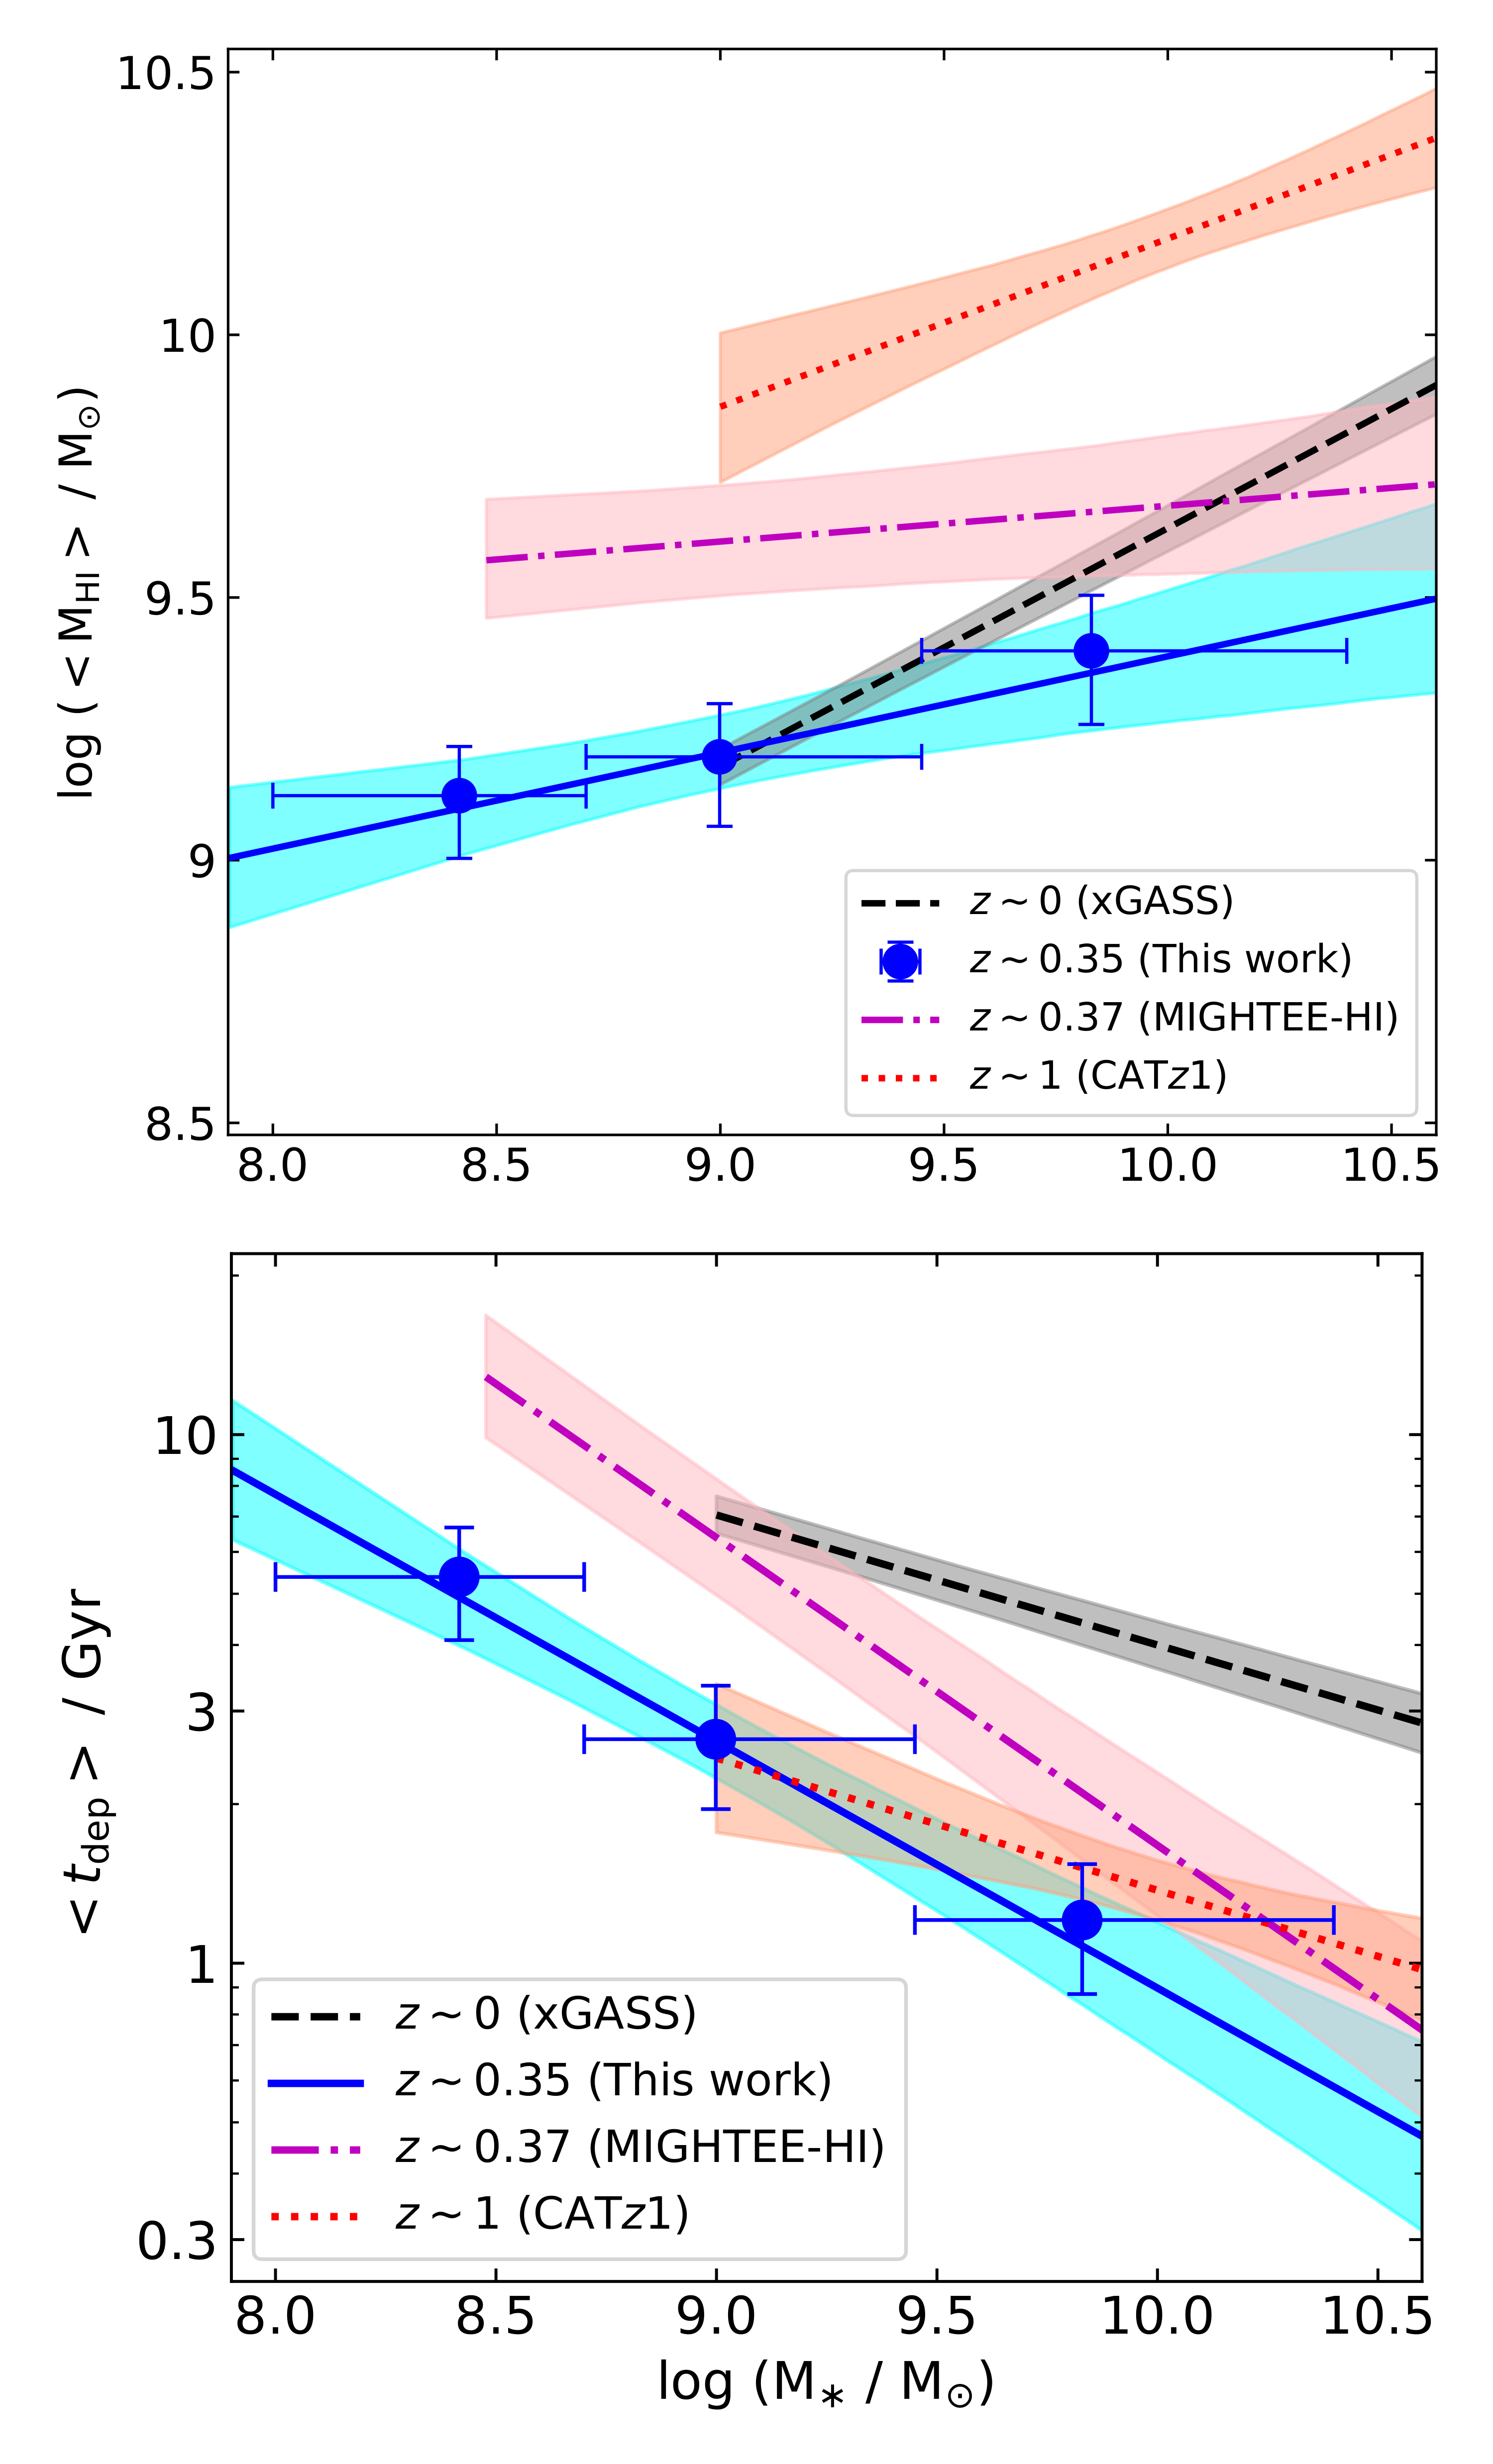
Atomic hydrogen scaling relations at z~0.35
The atomic hydrogen (HI) properties of star-forming galaxies in the local Universe are known to correlate with other galaxy properties via the “HI scaling relationsâ€. The redshift evolution of these relations serves as an important constraint on models of galaxy evolution. However, until recently, there were no estimates of the HI scaling relations at earlier epochs. Bera et al. used data from a deep upgraded GMRT HI 21 cm survey of the Extended Groth Strip, and the technique of spectral line stacking, to measure the scaling relation between the HI mass and the stellar mass for star-forming galaxies at redshift z ≈ 0.35. Using this measurement, along with the main-sequence relation between the stellar mass and star-formation rate of galaxies, they inferred the HI depletion timescale of star-forming galaxies as a function of their stellar mass, which is shown in the lower panel of the figure. They found that massive star-forming galaxies at z ≈ 0.35 are HI-poor compared to local star-forming galaxies of a similar stellar mass. However, their characteristic HI depletion time is shorter by a factor of ≈ 5 than that of their local analogues, indicating a higher star-formation efficiency at intermediate redshifts. The short characteristic HI depletion timescales, ≲ 3 Gyr, of massive star-forming galaxies at z ≈ 0.35 indicate that they must have acquired a significant amount of neutral gas through accretion from the circumgalactic medium, over the past 4 Gyr, to avoid quenching of their star-formation activity. In the attached figure, the upper panel shows the scaling relation between the HI mass and the stellar mass, while the lower panel shows the scaling relation between the HI depletion timescale and the stellar mass. The blue circles in both panels show the measurements of Bera et al., while the solid blue lines and blue shaded regions show their estimates of the scaling relations. The other three curves in each panel show the corresponding scaling relations (1) in the local Universe (black curve and grey shaded region), from the xGASS survey, (2) at z~0.37, from the MIGHTEE-HI survey (magenta dash-dotted curve and pink shaded region), and (3) at z~1.0 from the CATz1 survey (red dotted curve and orange shaded region).
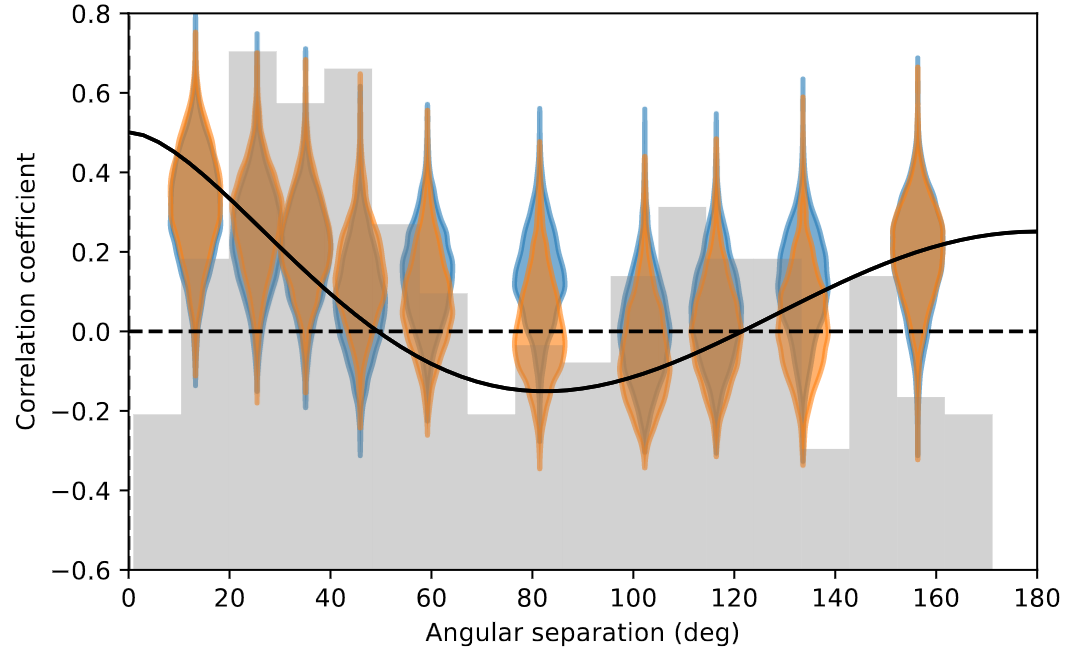
First evidences for the Gravitational Wave Background using the InPTA and the EPTA combined data
Continuous gravitational wave emissions are predicted in colliding galaxies from supermassive black hole binaries (SMBHB) that revolve around each other for millions of years before the ultimate merger. Superposition of continuous gravitational wave emissions from a large number of SMBHBs is expected to create a persistent stochastic gravitational wave background with wavelengths of the order of light years (in the nanohertz frequency range). Detection of such waves would require detectors with light-year arm lengths, and hence cannot be achieved by ground-based or even the upcoming advanced space-based gravitational wave detectors like LISA. However, nature has endowed us with ultra-precise galactic clocks named millisecond pulsars placed light years apart. Fine delay in the super-stable arrival time of radio pulses from these clocks has the potential to detect nanohertz gravitational waves causing the delay. In a recent series of papers published jointly by the Indian Pulsar Timing Array (InPTA) and the European Pulsar Timing Array (EPTA) collaborations, the first direct evidence of such a cosmic gravitational wave background is unraveled. InPTA data acquired using the upgraded Giant Metrewave Radio Telescope (uGMRT) plays a critical role in obtaining these results. In one of the papers (Paper-I), the low-frequency uGMRT data of very high quality was combined with mid and high-frequency data from five different radio telescopes of the EPTA leading to precise measurements of tiny stochastic noise caused by the ISM. Such noise in the intervening space masks the effects of nanohertz gravitational waves and needs to be carefully subtracted for the imprints of a gravitational wave background to emerge. This feat was achieved to a significant level of confidence, and early evidence of a gravitational wave background signal was reported in another paper (Paper-II) in the series. The accompanying figure shows the posterior of the correlation coefficients averaged at ten bins of angular separations with 30 pulsar pairs each (orange: InPTA+EPTA, blue:EPTA), along with the Hellings and Downs (HD) curve (black line) based on theoretical expectation of a GWB signal. [Paper-I: https://doi.org/10.1051/0004-6361/202346842 ; Paper-II: https://doi.org/10.1051/0004-6361/202346844]
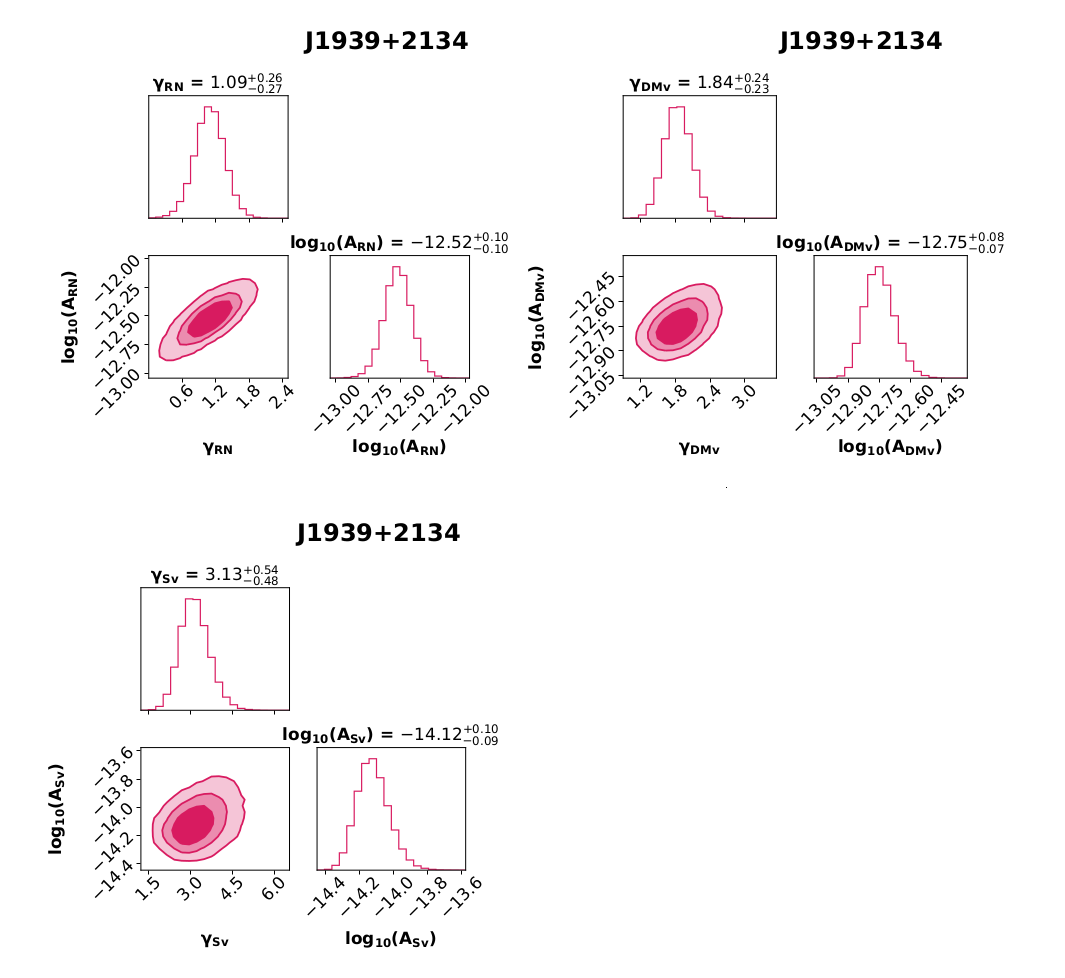
Noise analysis of the Indian Pulsar Timing Array data release I
Pulsar timing array (PTA) experiments aim to detect ultra-low frequency (∼ 1-100 nHz) gravitational waves (GWs) by monitoring an ensemble of MSPs distributed across the galaxy. GW signals in the PTA frequency range are typically expected to originate from orbiting supermassive black hole binaries (SMBHBs) in the inspiral phase, both as a stochastic GW background (GWB) formed by the incoherent addition of GWs from a large number of SMBHBs, and as strong individual sources standing out above this background. The intrinsic wander of the rotation rate of the constituent pulsars, the variations in dispersion measure (DM) and scatter-broadening caused by the interstellar medium, as well as the instrumental noise of radio telescopes are often covariant with the slowly varying GW signature in the data and act as sources of chromatic and achromatic noise. The detection and characterization of GWs are strongly affected by the faithfulness of noise models and can be highly dependent on custom noise modelling for each pulsar. This work presents the results of single-pulsar noise analysis for each of the 14 pulsars in the Indian Pulsar Timing Array (InPTA) first data release (DR1), which was made possible using the wideband and multi-frequency observations with the upgraded GMRT. This work considers white noise, achromatic red noise, DM variations, and scattering variations in the analysis, and applies Bayesian model selection to obtain the preferred noise models among these for each pulsar. Properties vary dramatically among pulsars. For example, For PSR J1600−3053, no evidence of DM and scattering variations is found, while for PSR J1909−3744, no significant scattering variations are found. A strong chromatic noise with chromatic index ∼ 2.9 is seen for PSR J1939+2134, indicating the possibility of a scattering index that doesn’t agree with that expected for a Kolmogorov scattering medium consistent with similar results for millisecond pulsars in past studies. Despite the relatively short time baseline, the noise models broadly agree with the other PTAs and provide, at the same time, well-constrained DM and scattering variations. The accompanying image shows the posterior distributions for pulsar J1939+2134, with 68%,90%,99% credible intervals for achromatic red noise, DM and Scattering variations.
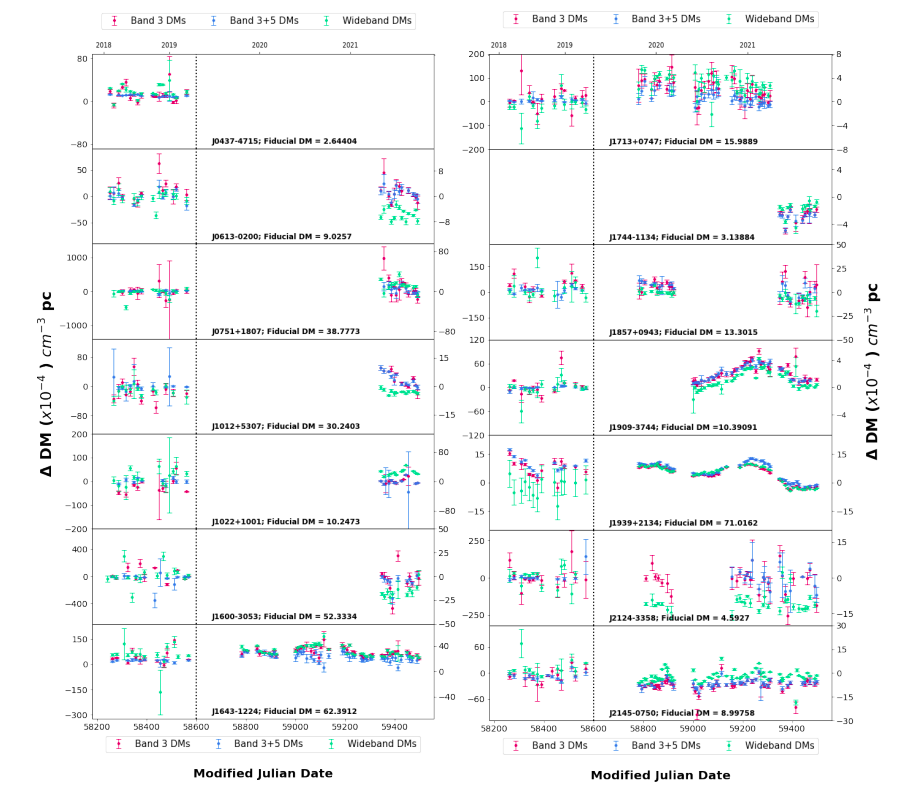
The Indian Pulsar Timing Array: First Data Release
The Indian Pulsar Timing Array (InPTA) announced its first official Data Release or the InPTA DR1 , published in October, 2022. The InPTA is an Indo-Japanese collaboration of about forty radio-astronomers working together with the International Pulsar Timing Array (IPTA) towards the detection of a low-frequency gravitational wave background. The InPTA data release stems from three and a half years of observation using the upgraded Giant Metrewave Radio Telescope (uGMRT) operated by the NCRA-TIFR. The uGMRT is capable of conducting simultaneous observations in multiple radio-frequency bands from the same source. The 30 dishes of the uGMRT are sub-divided into groups or sub-arrays , each with receivers recording radio signals arriving in different frequency bands at the same time. This feature grants InPTA the unique strength to measure the density of electrons in the interstellar medium (ISM) along our line of sight with some of the highest precisions obtained so far. Fluctuations in the ISM are known to act as notorious sources of noise that mimic the effects of low-frequency background gravitational waves in the pulsar signal arrival times. Hence, precise estimation of variations in the density of the ISM is crucial for identifying and filtering this noise. Such effects, being most prominent in low radio-frequencies, can most ideally be investigated by the Indian PTA using the distinctive low-frequency coverage of the uGMRT. Thus, the InPTA DR1 is a critical addition to the combined pool of data from the global PTA consortiums for a unified search for the elusive stochastic gravitational wave background. The accompanying figure shows the dispersion-measure time-series of 14 pulsars included in InPTA DR1.
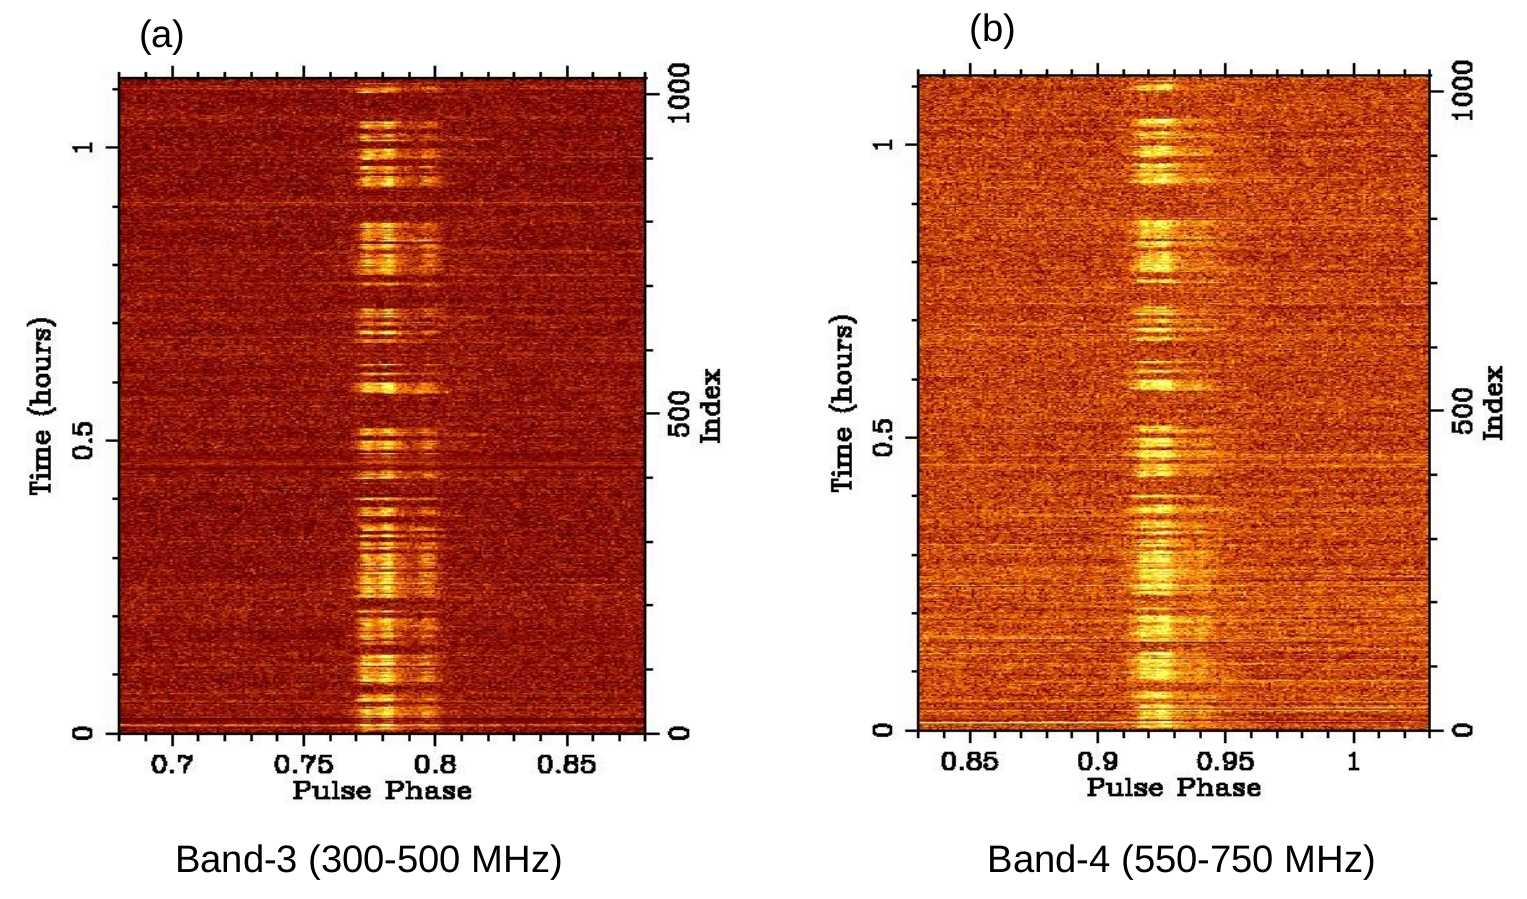
The GMRT High Resolution Southern Sky Survey for Pulsars and Transients. VI. Discovery of Nulling, Localization, and Timing of PSR J1244–4708
Many pulsars in the known population exhibit nulling, which is characterized by a sudden cessation and subsequent restoration of radio emission. Singh et al. present the localization, timing, and emission properties of a pulsar discovered by the GMRT High Resolution Southern Sky survey: J1244-4708. The authors find that the pulsar shows clear nulling, with a nulling fraction close to 60%. The nulling is found to be quasiperiodic, with two timescales. The authors demonstrate the broadband nature of the nulling in this pulsar via simultaneous GMRT observations in Band-3 (300-500 MHz) and Band-4 (550–750 MHz) (see the adjacent figure). The fact that this pulsar shows quasiperiodicity in nulling and the nulling is seen simultaneously in two widely separated frequency bands, favors the cessation of coherent radio emission as the origin of nulling in this pulsar. The authors also present a comparison of the efficiency of various search approaches such as single pulse search, fast folding algorithm (FFA)-based search, and fast Fourier transform (FFT)-based search, to search for nulling pulsars. They conclude that the FFA search is advantageous for detecting extreme nulling pulsars (nulling fraction > 80%); this is also confirmed with multiple epochs of observations of two nulling pulsars using the GMRT.
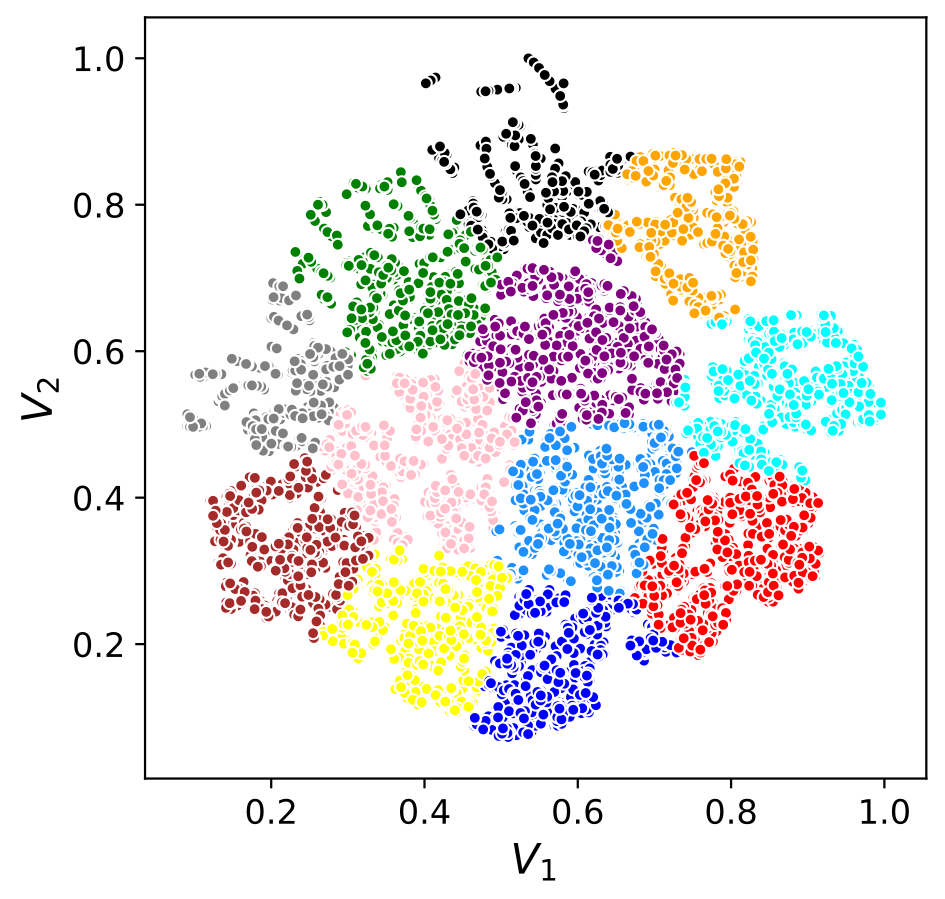
An Unsupervised Machine Learning-based Algorithm for Detecting Weak Impulsive Narrowband Quiet Sun Emissions and Characterizing Their Morphology
This work by Bawaji et al. continues the theme of building a detailed observational characterisation of the Weak Impulsive Narrowband Quiet Sun Emissions (WINQSEs). WINQSEs were discovered using the Murchison Widefield Array (MWA) by Mondal et al. (2020) and have thus far met all of the criterion for being the radio coutnerparts of nanoflares, hypothesised by Parker to explain coronal heating. Bawaji et al. investigate the morphological properties of WINQSEs, while also improving upon the earlier methodology used for detecting WINQSEs. They present a machine learning-based algorithm to detect WINQSEs, classify them based on their morphology, and model the isolated ones using 2D Gaussians. The figure shows the results from first using the t-SNE algorithm for condensing the information from the entire feature set for each of the detected WINQSEs into a two-dimensional space, and then using the DBSCAN algorithm to group similar features together. Interestingly, despite the expectations of their arising from intrinsically compact sources, Bawaji et al. find that WINQSEs tend to be resolved in their observations. They propose that this angular broadening arises due to coronal scattering and suggest that WINQSEs can provide ubiquitous and ever-present diagnostic of coronal scattering (and, in turn, coronal turbulence) in the quiet Sun regions, which has not been possible to date.
Deciphering Faint Gyrosynchrotron Emission from a Coronal Mass Ejection Using Spectropolarimetric Radio Imagin
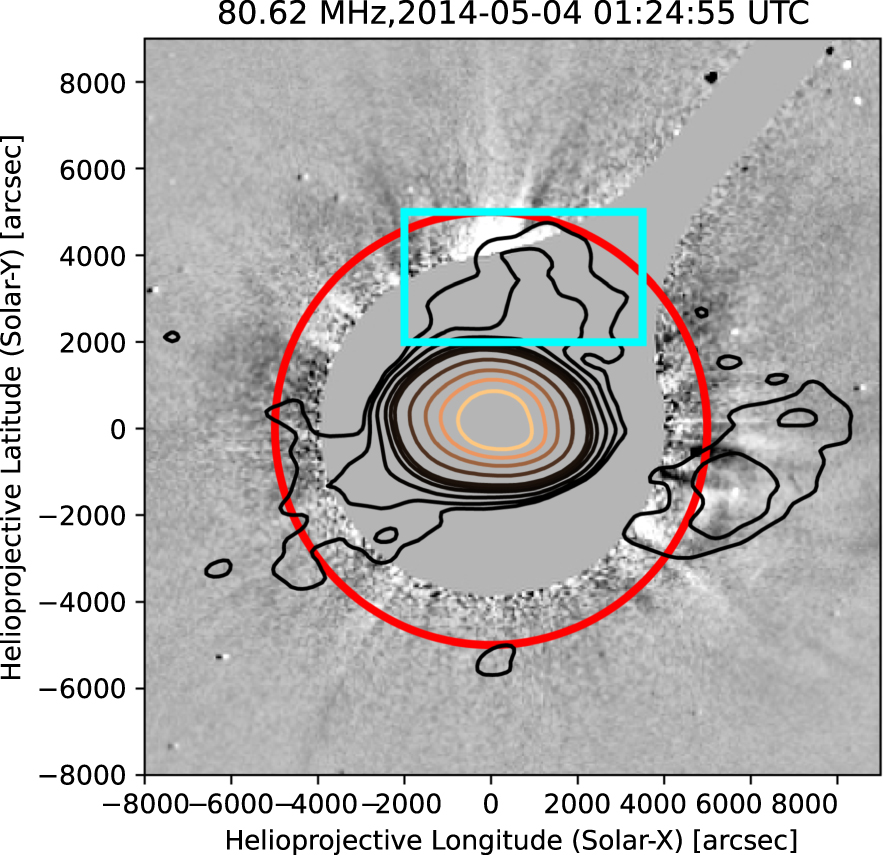
Coronal mass ejections (CMEs) are large-scale expulsions of magnetized plasma from the solar corona into the heliosphere. Measurements of the CME plasma parameters, particularly the magnetic field and the nonthermal electron population entrained in the CME, are crucial to understanding CME propagation, evolution, and geo-effectiveness. Spectral modeling of the gyrosynchrotron (GS) emission from CME plasma has long been regarded as one of the most promising remote-sensing techniques for estimating spatially-resolved CME magnetic fields and other plasma parameters. Imaging the very low flux density CME GS emission in the close proximity of the Sun, which has a flux density higher by many orders of magnitude, has however proven to be rather challenging. This challenge has only recently been met using the high dynamic range imaging capability of the Murchison Widefield Array (MWA). The MWA allows us to detect faint GS radio emissions from the entire CME marked by the cyan box in the figure. The radio emission is shown by contours overlaid on white-light coronagraph difference images. Although routine detection of GS emission from CMEs is now within reach, the challenge has shifted to constraining the large number of free parameters in GS models, some of which are degenerate, using the limited number of spectral points at which the observations are typically available. These degeneracies can be broken using polarimetric imaging. For the first time, we demonstrate this using our recently developed capability of high-fidelity polarimetric imaging of MWA data. We show that spectropolarimetric imaging, even when only sensitive upper limits on the circular polarization flux density are available, not only is able to break the degeneracies in the model parameters but also yields tighter constraints on the key plasma parameters of interest than possible with total intensity spectroscopic imaging alone.