Science Highlights
GMRT Discovery of PSR J1544+4937: An Eclipsing Black-widow Pulsar Identified with a Fermi-LAT Source
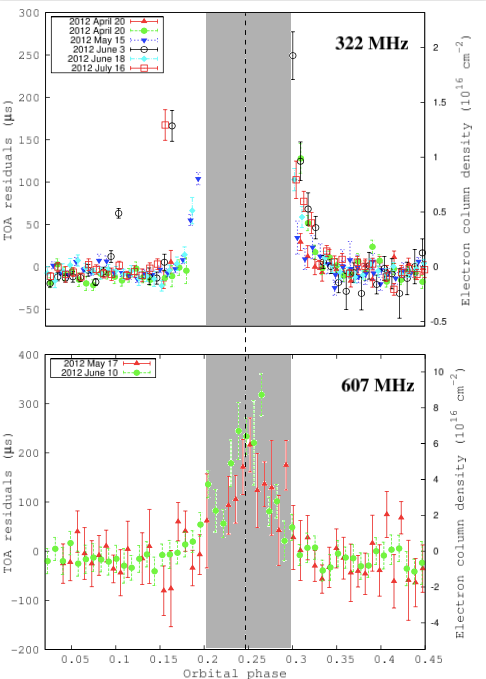
Bhattacharyya et al. used the GMRT to perform deep observations to search for radio pulsations in the directions of unidentified Fermi Large Area Telescope (LAT) gamma-ray sources, resulting in the discovery of a new milli-second pulsar (MSP), PSR J1544+4947, an eclipsing MSP in a special evolutionary state. PSR J1544+4937 is a 2.16 ms pulsar in a 2.9-hour compact circular orbit with a very low-mass companion star (mass > 0.017 solar masses). At 322 MHz, the pulsar is found to be eclipsing for 13% of its orbit, whereas at 607 MHz the pulsar is detected throughout the low-frequency eclipse phase. Variations in the eclipse ingress phase are observed, indicating a clumpy and variable eclipsing medium. Moreover, additional short-duration absorption events are observed around the eclipse boundaries. The authors used the radio timing solutions to detect gamma-ray pulsation from the pulsar, confirming it as the source powering the gamma-ray emission. The figure shows the frequency-dependent eclipsing detected with the GMRT in PSR J1544+4937. The pulsar radiation is seen to be eclipsed by the companion star at 322 MHz, but not at 607 MHz. The figure plots the variation of the timing residuals and the electron column density around the eclipse phase (which is indicated by the shaded region) at 322 MHz (top) and 607 MHz (bottom).
The GMRT High Resolution Southern Sky (GHRSS) survey
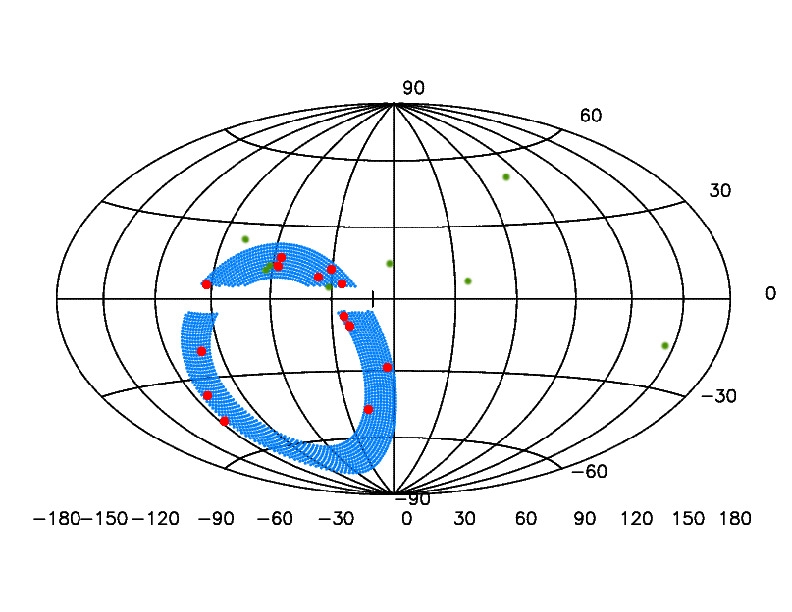
Bhattacharyya et al. used the outstanding GMRT potential for low-frequency pulsar surveys in the GMRT High Resolution Southern Sky (GHRSS) survey, a low-frequency survey for pulsars and transients away from the Milky Way s plane. The GHRSS survey covers Galactic latitudes |b|>5 degrees, scanning the southern sky, with declination -40 degrees to -54 degrees. This declination coverage is complementary to the coverage of other ongoing low-frequency sky surveys around the world. The first phase of the GHRSS survey was carried out using the narrow bandwidths of the GMRT Software Backend, at 322 MHz, and has already resulted in the discovery of bunch of new pulsars with exciting properties. Bhattacharyya et al. discovered 13 pulsars in the GHRSS survey in a surveyed area of 1800 square degrees, i.e. 0.007 pulsars per square degree, which is one of the highest among pulsar surveys away from the Milky Way’s plane. GHRSS survey discoveries include a millisecond pulsar (in a ~10 hour orbit around a ~0.18 solar mass companion star), a pulsar for which gamma-ray pulsations have been discovered using the Fermi Large Area Telescope, and two mildly recycled pulsars. The second phase, using the GMRT Wideband Backend and the 250-500 MHz receivers of the upgraded GMRT is now under way. The figure shows the 21 pulsars discovered by the GMRT between 2012−2017 from targeted and blind surveys. Fermi-directed discoveries are shown as green points; the blue shaded region indicates the sky coverage in Galactic coordinates of the GHRSS survey, while the pulsars discovered in this survey are shown as red points Details: http://www.ncra.tifr.res.in/ncra/research/research-at-ncra-tifr/research-areas/pulsarSurveys/GHRSS
Stringent constraints on changes in the proton-electron mass ratio over 7.5 Gyrs from methanol lines
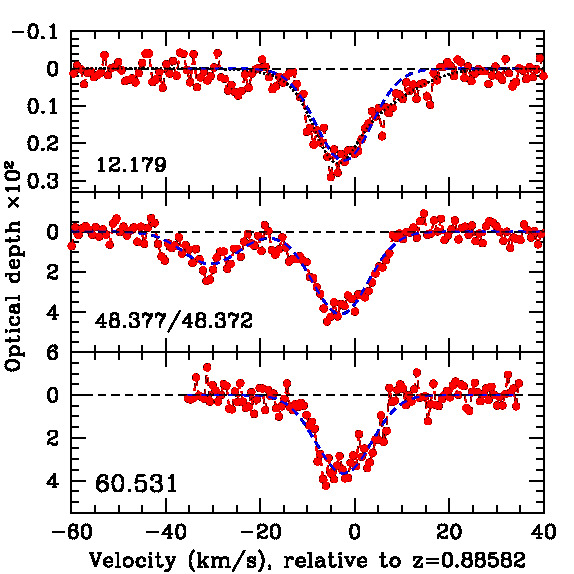
Kanekar et al. used the Karl G. Jansky Very Large Array (VLA) to obtain deep absorption spectra in four methanol (CH3OH) lines from the z=0.88582 gravitational lens towards PKS1830-211. Three of the four CH3OH lines have very different sensitivity coefficients to changes in the proton-electron mass ratio mu=m_p/m_e. A comparison between the redshifts of these lines thus allows one to test for temporal evolution in mu. Kanekar et al. compared the line shapes of the three CH3OH lines that have similar rest frequencies, 48.372, 48.377 and 60.531 GHz, and found their line profiles to be in excellent agreement. This yielded a robust constraint of ~4 parts in ten million on fractional changes in mu; this is the most stringent current constraint on changes in mu. Kanekar et al. thus find no evidence for changes in the proton-electron mass ratio over a lookback time of ~7.5 Gyr. The figure to the right shows the four CH3OH lines detected in the z=0.88582 lens with the VLA (two of the lines are in the middle panel, blended with each other); the line rest frequencies in Ghz are listed on the top left of each panel. The dashed blue curve in each panel shows a single Gaussian fit to each line.
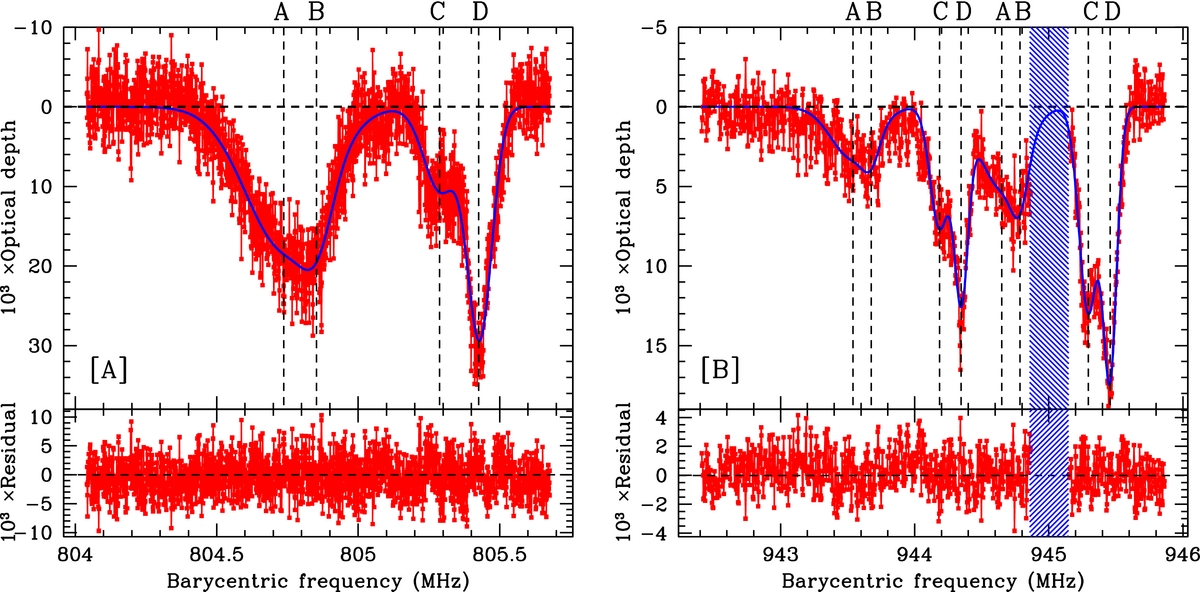
Constraints on fundamental constant evolution from HI 21cm and OH 18cm lines
Kanekar et al. used the Green Bank Telescope to carry out spectroscocpy in the redshifted neutral hydrogen (HI) 21cm and hydroxyl (OH) 18cm lines from the z=0.765 absorption system toward the quasar PMN J0134-0931. A comparison between the "recentResults"satellite OH 18cm line redshifts, or between the redshifts of the HI 21cm and "recentResults"main OH 18 cm lines, is sensitive to changes in different combinations of the fine structure constant (alpha) and the proton-electron mass ratio (mu = m_p/m_e). A comparison between the redshifts of the HI 21cm and the OH 18cm lines, via a multi-Gaussian fit, yielded strong constraints on changes in a combination of alpha and mu, and no evidence for a change in the constants between z=0.765 and the present epoch. Incorporating the independent constraints on fractional changes in mu from another absorber at a similar redshift, Kanekar et al. found that fractional changes in alpha are less than ~3 parts in a million (at 2 sigma significance) over a look-back time of 6.7 Gyr. The top panels of the figure to the right show the HI 21cm and 18cm lines detected with the Green Bank Telescope, with the multi-Gaussian fit shown in blue. The lower panels show the residuals from each fit, which can be seen to be consistent with noise.
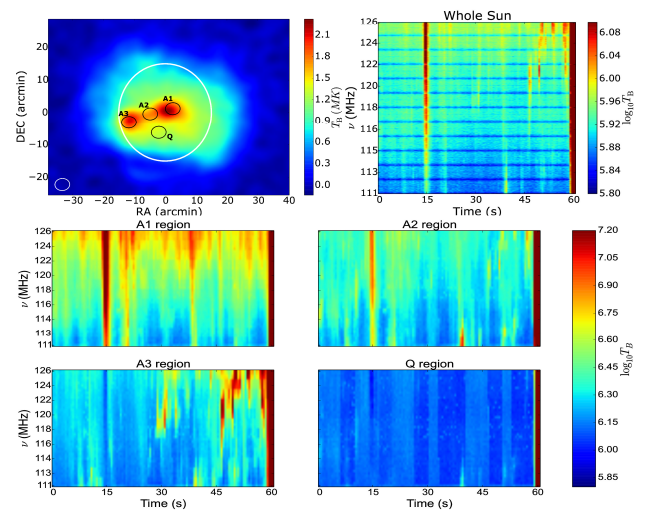
Introducing SPatially REsolved Dynamic Spectra for the Sun
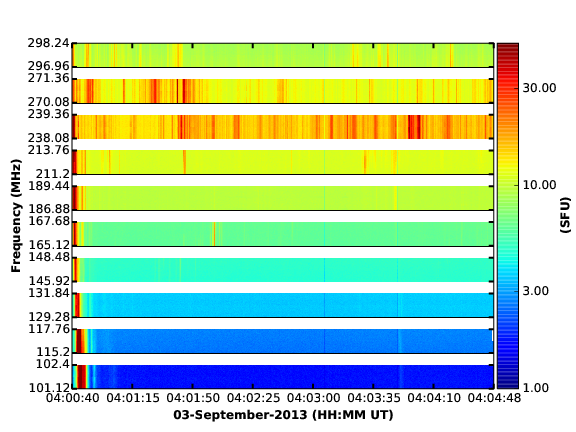
Low radio frequency solar emission spans a very large range in intensity, as well as temporal, spectral and spatial scales. Often multiple processes are going on simultaneously at different locations on the Sun, giving rise to different emissions. These emissions can differ greatly in their strengths and till recently one could usually only study the most intense of these sources. The significantly improved imaging dynamic range of the Mileura Widefield Array (MWA) is now making it possible to study comparatively weaker emissions in presence of more intense ones. In order to facilitate such studies, we have recently developed a new data product which will enable scientists to study the frequency and time variations of the emission coming from any specific patch on the Sun. Called SPREDS, an acronym for SPatially REsolved Dynamic Spectrum, it is named in analogy with the usual definition of a dynamic spectrum, which shows the variations of the emission in the time-frequency plane. We also presented the first flux calibrated solar images from the MWA. The accompanying figure shows an example: the top left panel shows a radio image of the Sun with some regions marked on it; the top right panel shows the dynamic spectrum for the entire Sun, which is the data product used most commonly at these frequencies; the remaining panels show the SPREDS from the corresponding regions marked in the solar disc. Note that the colour scale for these panels is in log scale, the differences between emissions from different regions on the Sun are self evident.
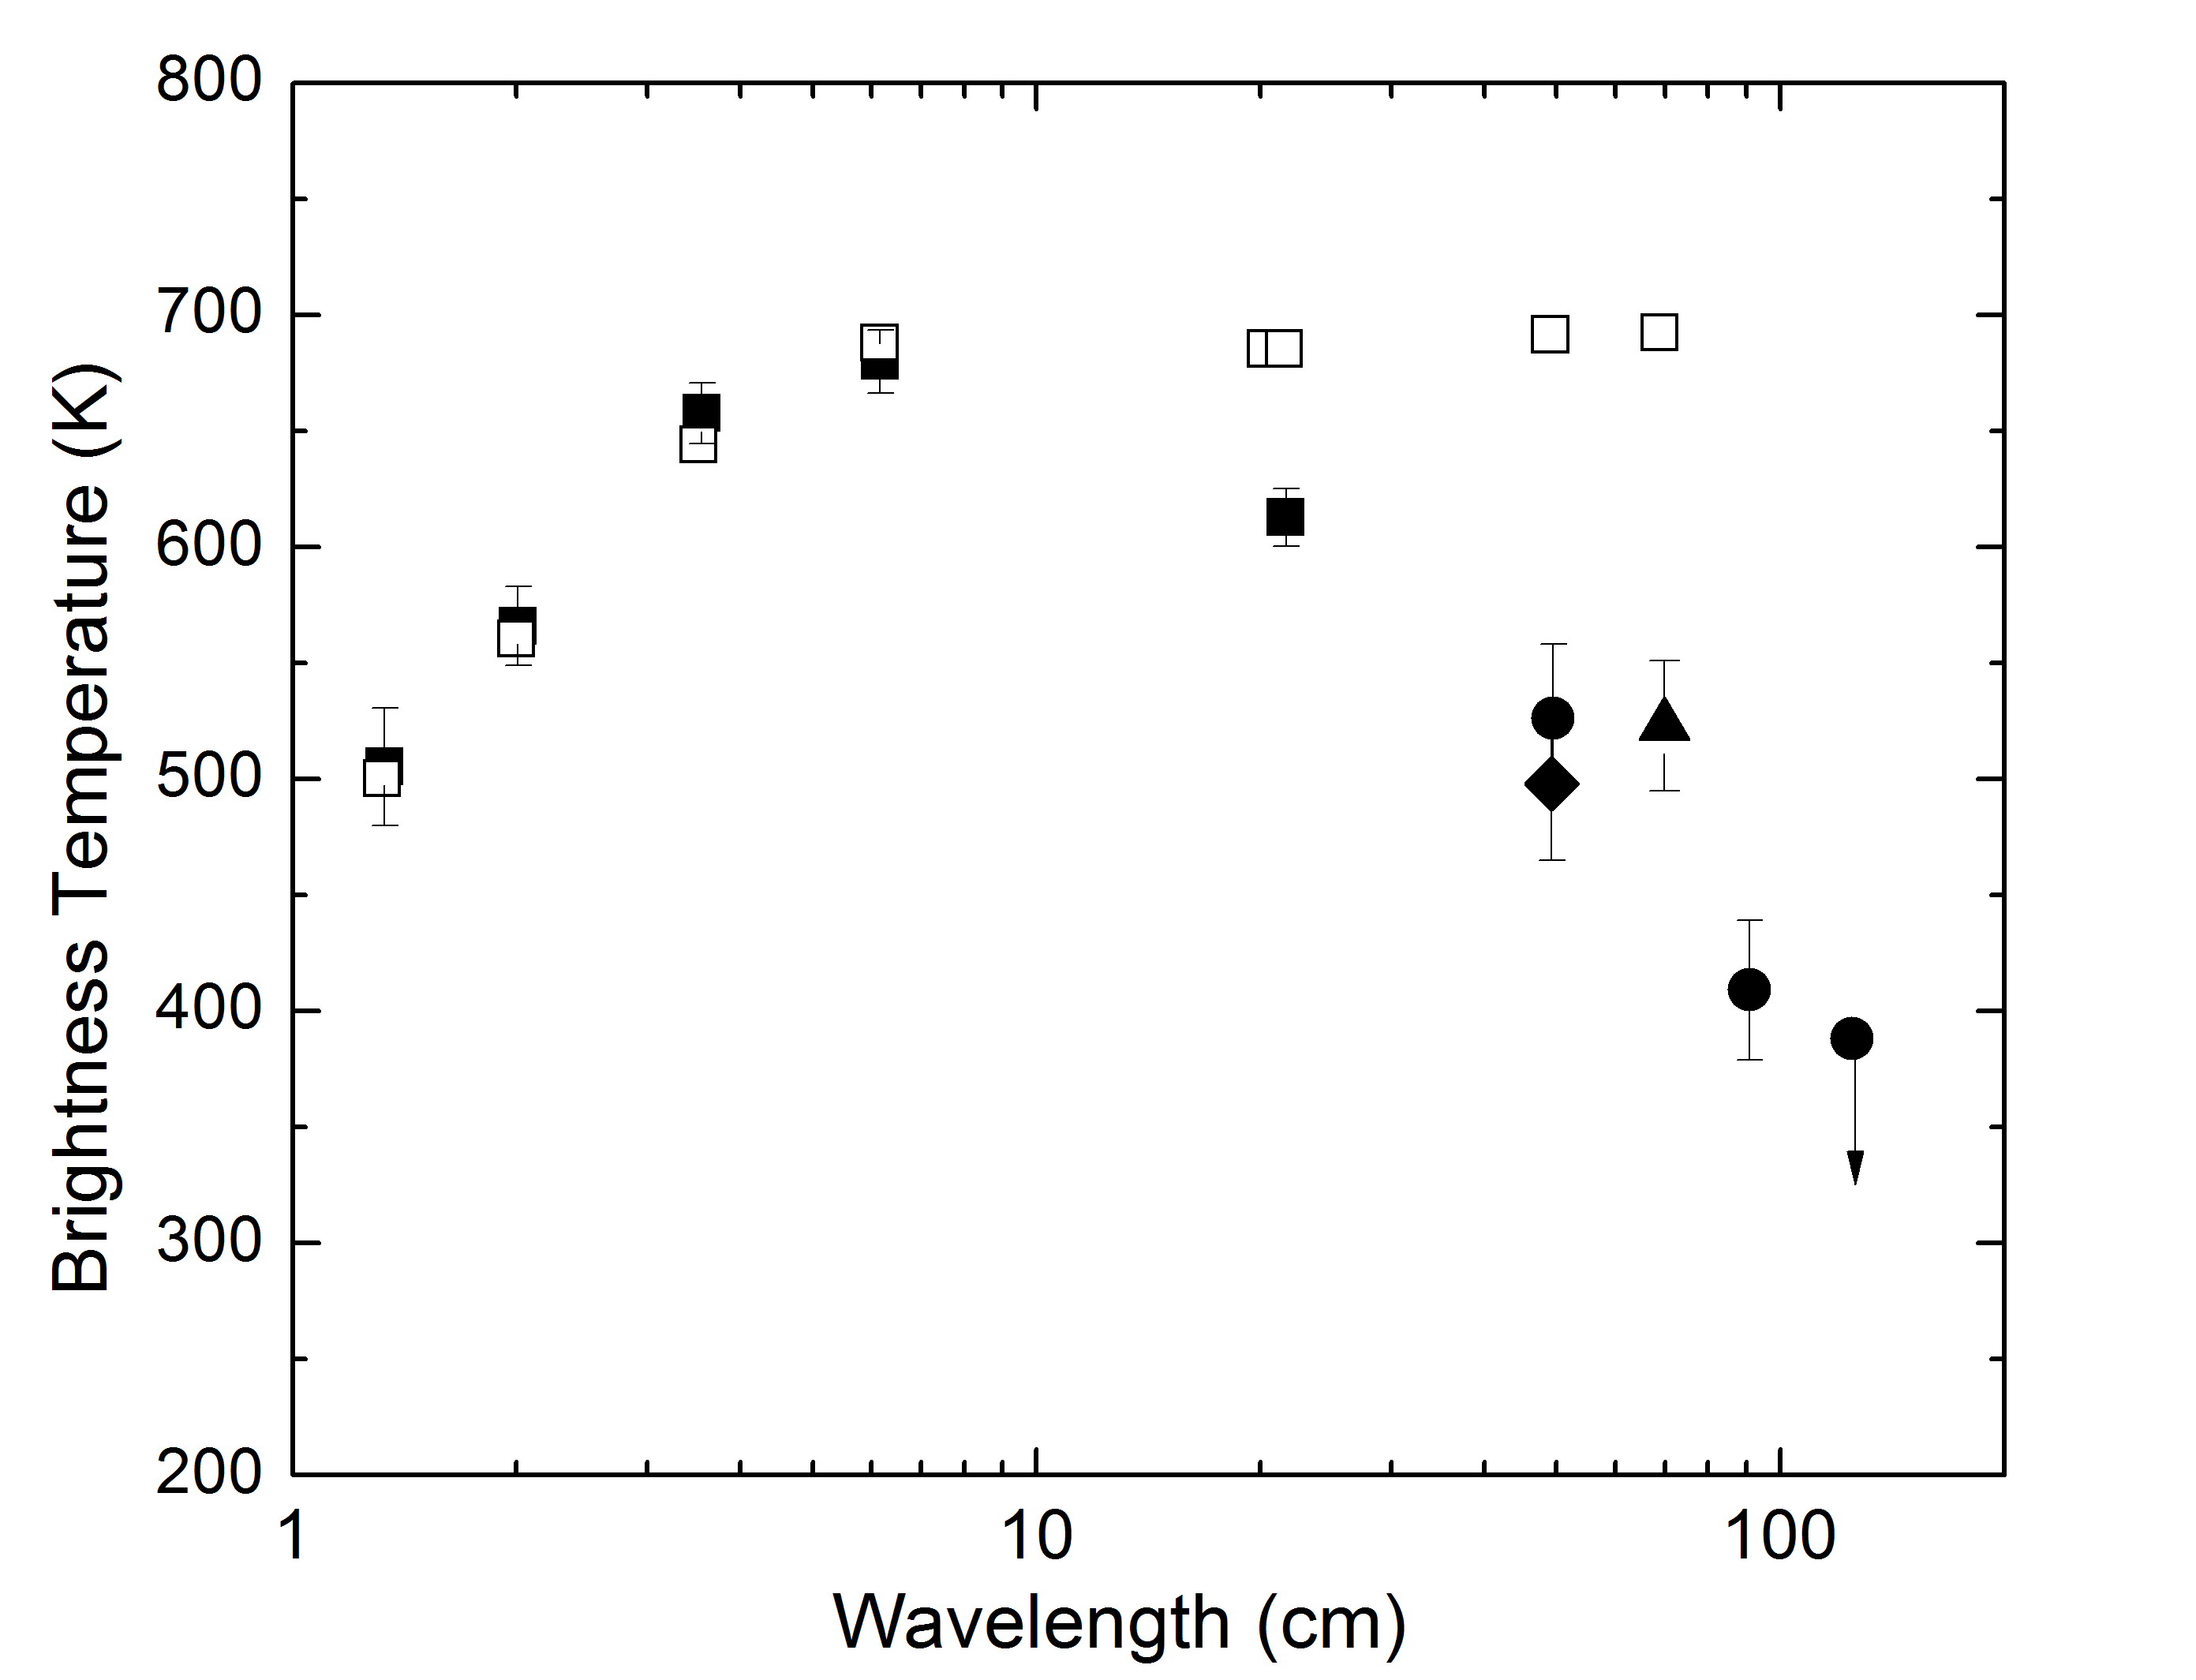
Radio observation of Venus using the GMRT
The surface of Venus has been studied by measuring radar reflections and thermal radio emission over the spectral range from several centimetres to metre wavelengths using Earth-based as well as orbiter platforms. Earlier non-imaging radio observations of Venus in the decimeter wavelength regime show a decreasing trend in the observed brightness temperature with increasing wavelength. The present-day thermal emission models however predict the brightness temperature to remain constant above wavelengths of about 10 cm. Mohan et al. report the first interferometric imaging observations of Venus below 620 MHz, which provide reliable brightness temperature measurements, and confirm this discrepancy. These observations were carried out at 606, 333 and 240 MHz using the GMRT. The brightness temperature values derived at the respective frequencies are 526 K, 409 K and <426 K, with errors of ∼7% which are generally consistent with the reported temperatures at 608 MHz and 430 MHz by previous investigators, but are much lower than those obtained by extrapolating from high-frequency observations at 1.38-22.46 GHz using the VLA. The circle and triangles show the measurements from this work, while the open boxes show the model prediction.
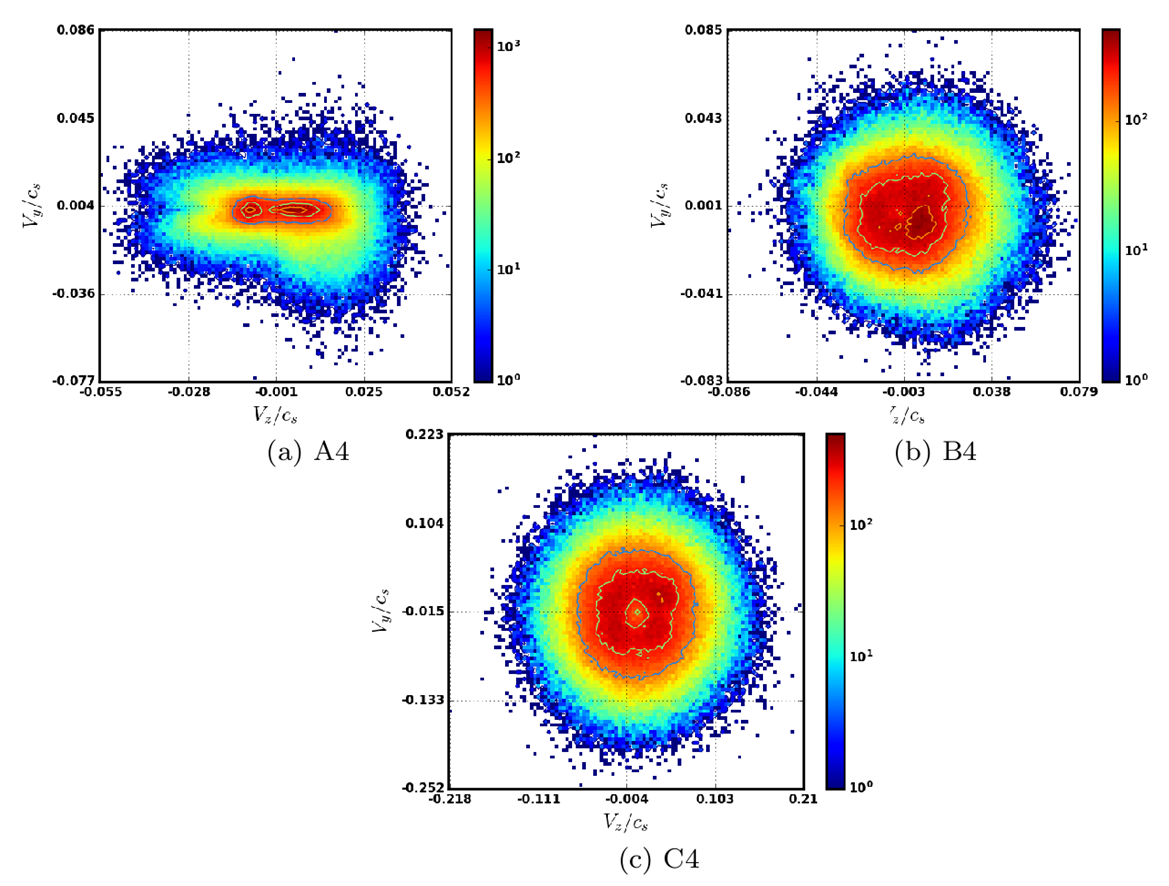
Energisation of Charged Particles by Fast Magnetic Reconnection
Magnetic reconnection has long been understood to be the primary mechanism responsible for the generation of non-thermal electron distributions, which in turn are responsible for the coherent non-thermal emissions at low radio frequencies. However a detailed understanding of the nature of particle acceleration due to reconnection is still lacking. Sharma et al. have carried out a first attempt to understand the details of this process using a 3D magnetohydrodynamics (MHD) framework. They investigate the role of turbulence on the reconnection rate and also study the distributions of energised particles using test-particles. They find that with increasing turbulent intensity the system enters what is usually termed the fast reconnection regime. The speeds of the energised particles are found to follow a Maxwellian distribution whose variance increases with the strength of the reconnecting field. The accompanying figure shows the joint normalised probability distribution functions of velocities of these energised particles along two perpendicular directions for (a) a low turbulence strength, (b) medium turbulence strength and (c) high turbulence strength cases.
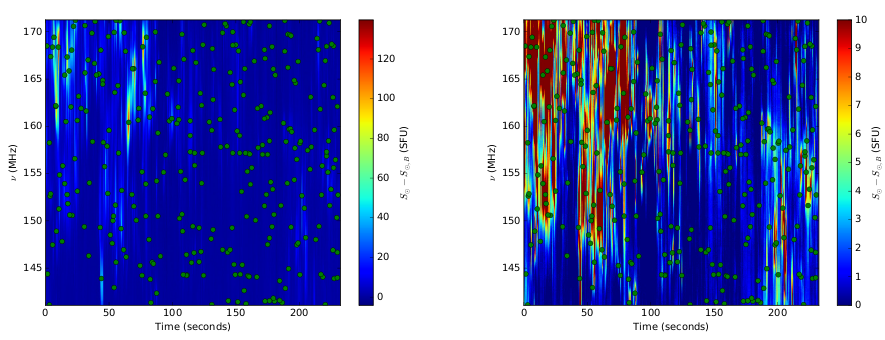
Wavelet-based Characterization of Small-scale Solar Emission Features
Low radio frequency solar observations using the Murchison Widefield Array (MWA) have revealed the presence of numerous weak short-lived narrowband emission features, even during moderately quiet solar conditions. These non-thermal features occur at rates of many thousands per hour in the 30.72 MHz observing bandwidth, and hence necessarily require an automated approach for their detection and characterization. Suresh et al. have developed an algorithm which employs continuous wavelet transform for feature detection in the dynamic spectrum. The green circles in the figure show the peaks of the features detected in an example MWA dynamic spectrum. The left and the right panels differ only in the colour bar range and show the efficacy of this implementation in detecting features across a range of intensities, and temporal and spectral spans. They represent the first statistically robust characterization of the properties of these features. This technique can reliably detect features weaker than 1 SFU (1 SFU = 10,000 Jy), the weakest non-thermal radio emissions so far reported in the literature. The features, which typically last for 1-2 seconds and span bandwidths of 4-5 MHz, can potentially provide an energetically significant contribution to coronal and chromospheric heating. They appear to ride on a broadband background continuum, hinting at the likelihood of their being weak, type-I solar bursts.
GMRT monitoring of the X-ray binary V404 Cygni during its June 2015 outburst
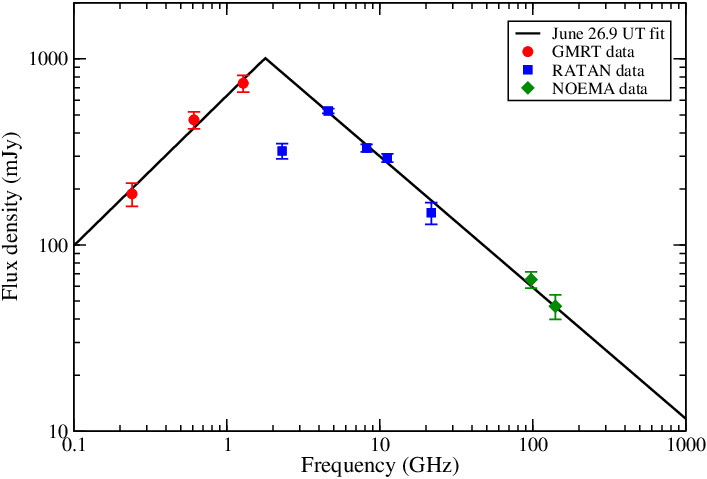
Chandra & Kanekar used the GMRT at 1280, 610, 325 and 235 MHz to monitor the black hole X-ray binary V404 Cygni during its 2015 June outburst, extending for a period of 2.5 weeks, and beginning on June 26.9 UT, a day after the strongest radio/X-ray outburst. They find the low-frequency radio emission of V404 Cygni to be extremely bright and fast-decaying in the outburst phase, with an inverted spectrum below 1.5 GHz and an intermediate X-ray state. The radio emission settles to a weak, quiescent state roughly 11 days after the outburst, with a flat radio spectrum and a soft X-ray state. Combining the GMRT measurements with flux density estimates from the literature, the authors identify a spectral turnover in the radio spectrum at ~1.5 GHz on June 26.9 UT (see the attached image), indicating the presence of a synchrotron self-absorbed emitting region. They use the measured flux density at the turnover frequency with the assumption of equipartition of energy between the particles and the magnetic field to infer the jet radius, magnetic field, minimum total energy, and transient jet power. The relatively low value of the jet power, despite V404 Cygni’s high black hole spin parameter, suggests that the radio jet power does not correlate with the spin parameter.
Estimating Solar Flux Density at Low Radio Frequencies
As the Sun is much brighter than the typical radio sources used for flux calibration, absolute flux calibration of solar observations is challenging. At low radio frequencies, this becomes even harder due to large fields of view of the instruments. Turning this large field-of-view into an advantage, Oberoi et al. have developed a technique suitable for a low resolution interferometric baseline to provide robust absolute solar flux calibration. Working with well-characterized antennas and receiver systems, this technique relies on using the available detailed full sky radio maps. It provides a reliable and computationally lean method for extracting parameters of physical interest using a small fraction of the voluminous interferometric data, which can be computationally prohibitively expensive to calibrate and image using conventional approaches. The figure shows an example application of this technique to data from the Murchison Widefield Array. It shows the computed values of solar flux in solar flux units (SFU; 1 SFU=10,000 Jy) as a function of time for ten spectral bands between 100 and 300 MHz.