Science Highlights
First Robust Detection of Linear Polarization from Metric Solar Emissions: Challenging Established Paradigms
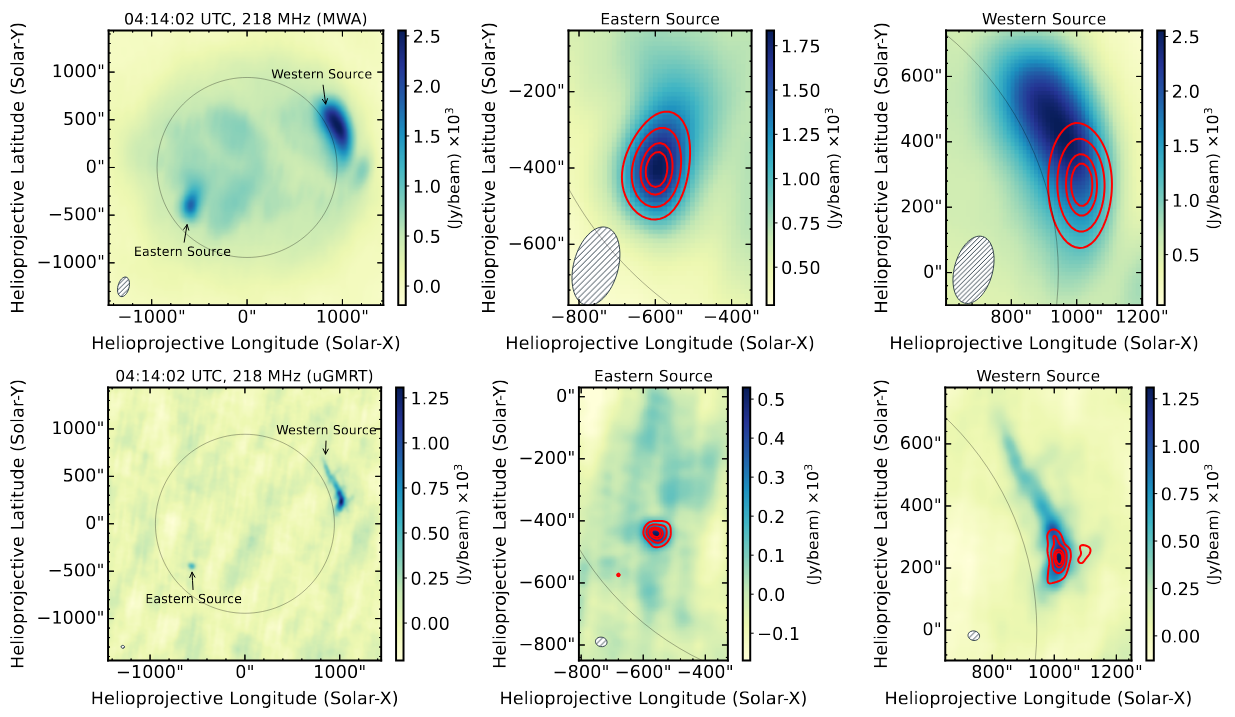
Solar polarimetric studies at meter wavelengths have long assumed that any observed linear polarization must be of instrumental origin. This assumption stems from theoretical expectations that strong Faraday rotation in the solar corona would erase any intrinsic linear polarization. Dey et al. report the first robust detection of linear polarization in solar emissions at meter wavelengths, based on simultaneous observations at overlapping frequencies, using two instruments with fundamentally different designs and geographically widely separated: the Murchison Widefield Array (MWA) and the upgraded Giant Metrewave Radio Telescope (uGMRT). The observations, carried out on 25 June 2022 in the 217–247 MHz band, captured linearly polarized emissions from both type I noise storms and a type III burst. Independent calibration and analysis procedures for the two instruments yielded consistent linear polarization fractions, ruling out a common instrumental origin. The adjacent figure shows the contours of linearly polarized emission (in red) overlaid on total intensity (Stokes I) maps for two solar noise storms observed with the MWA (upper panels) and the uGMRT (lower panels). The eastern source, weaker in Stokes I, has a linear polarization fraction of 13.5% ± 0.5% measured using the MWA and 12.3% ± 2.0% using uGMRT. The brighter western source exhibits a lower linear polarization, 6.0% ± 0.3% measured with MWA and 5.9% ± 0.5% with the uGMRT. Dey et al. also showed rapid, source-specific variations in the observed linear polarization on short time and frequency scales, as well as changes in the morphology of the linearly polarized source, further confirming their solar origin. The unexpected presence of linear polarization implies that the calibration schemes that rely on the assumption of zero linear polarization — a common practice in low-frequency solar polarimetric studies — can potentially bias circular polarization estimates as well, leading to incorrect physical inferences. This result challenges a decades-old paradigm in solar radio physics and opens the possibility of using full-Stokes, low-frequency spectropolarimetric imaging to probe coronal magnetic fields and plasma structures. The discovery also has implications for interpreting coherent radio bursts from other stellar systems, where linear polarization is often used to infer emission mechanisms, guided by the knowledge from solar radio physics.
Varying Activity and the Burst Properties of FRB 20240114A Probed with GMRT Down to 300 MHz
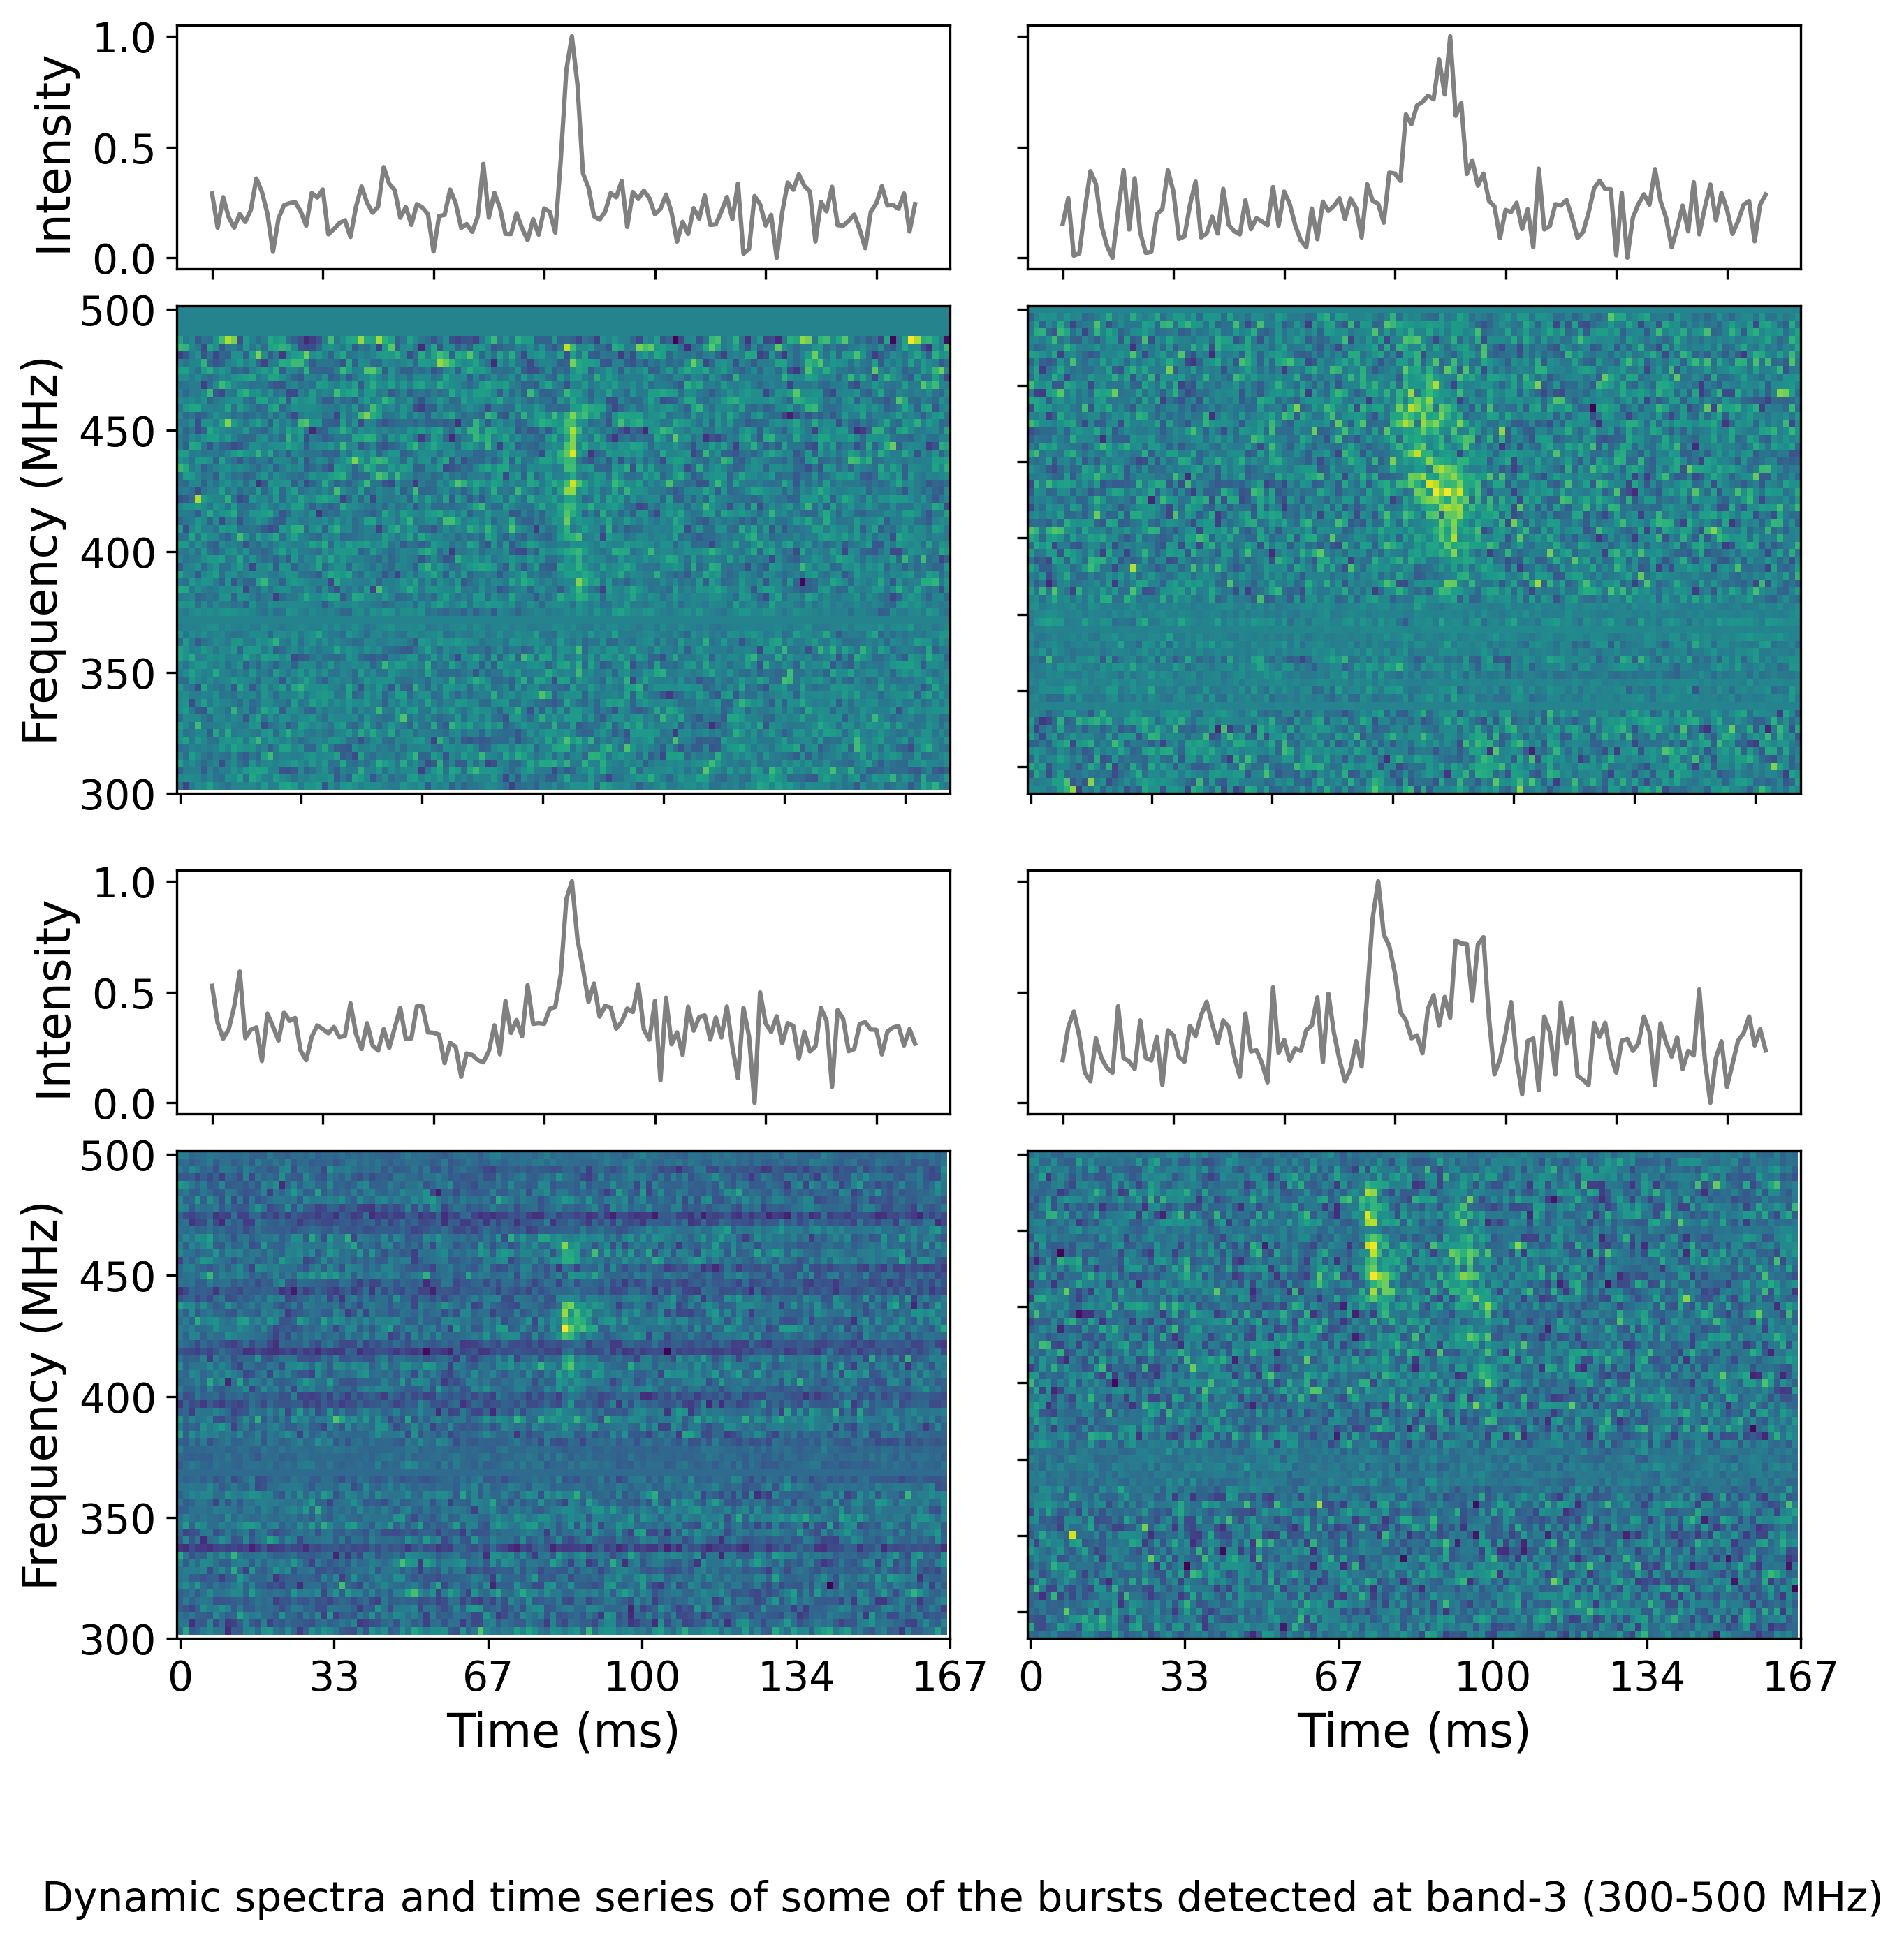
The origin of Fast Radio Bursts (FRBs) remains a major open question in astrophysics. Some FRBs are known to repeat, enabling targeted follow-up with sensitive facilities such as the uGMRT. Repeating FRBs, with their narrowband emission, downward frequency drifts, and variable burst rates, offer a unique opportunity to probe intrinsic emission processes and propagation effects. We present uGMRT observations of the active repeater FRB 20240114A in the 300 to 750 MHz frequency range, detecting 60 bursts, including events as faint as 0.1 Jy ms. Burst rates reached up to 31 per hour, measured within 10 minutes of FAST detections exceeding 500 per hour. The burst fluence distribution follows a power law with index -1.24 +/- 0.11. Most bursts are narrowband (about 10% fractional bandwidth) and many show clear downward drifts (-0.35 to -11.7 MHz per millisecond), extending the low-frequency regime of the drift-frequency relation and supporting curvature radiation in magnetized environments. Multi-telescope reports (ATels) suggest frequency-dependent activity, with low-frequency detections clustering earlier than >2 GHz events, contrary to chromatic activity in FRB 20180916B. Interferometric imaging places 3-sigma limits of <= 600 uJy at 400 MHz and <= 89 uJy at 650 MHz on any persistent radio source, far below those of FRB 20121102A and FRB 20190520B. The source remained active till our final session, highlighting the importance of ongoing multi-wavelength monitoring to uncover the origins of FRB 20240114A and repeating FRBs in general.
A Direct Measurement of the Electron Density Turbulence Parameter C_1 and Implications for the Emission Size of Magnetar XTE J1810-197
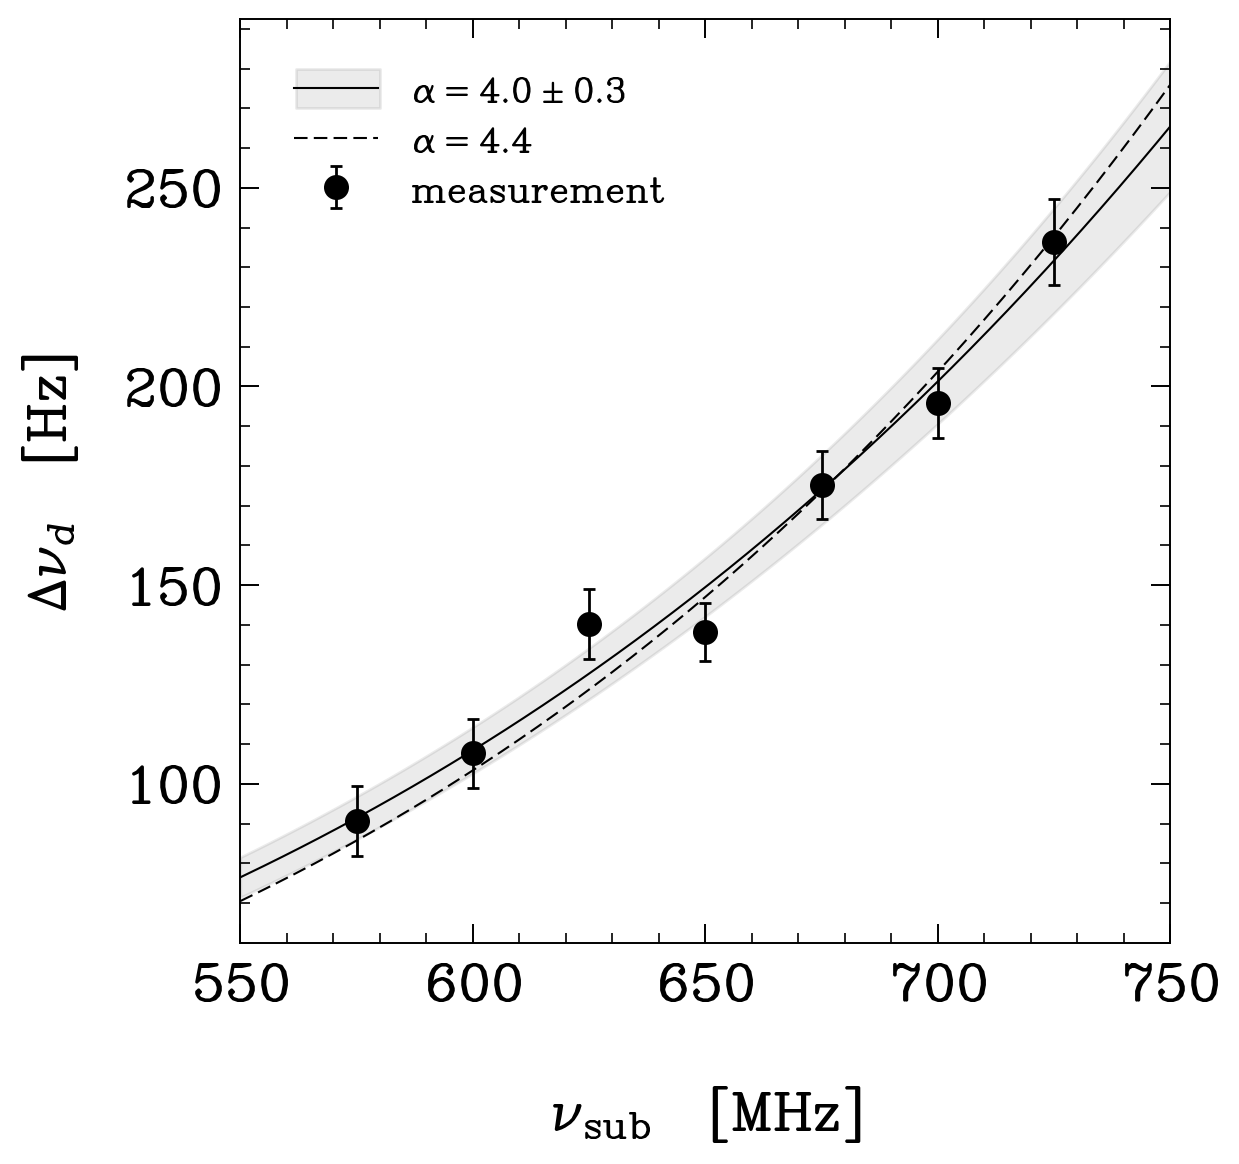
Although all pulsars scintillate at radio frequencies, scintillation is challenging to measure at higher dispersion measures (DM). The enhanced scattering results in interference of off-axis electric field from large delays, resulting in scintillation with fine structure. Typically, either the scattering or scintillation is measurable due to the inverse relation between the two. For clearly discernible scintillation, such as e.g. seen in a typical dynamic spectrum of a low-DM pulsar, there is negligible scattering, while at high DM there is appreciable scattering but the scintillation has fine structure. However, given a sufficiently capable observing configuration, both the quantities can be measured: i.e. scintillation through a high spectral resolution autocorrelation, and scattering through a high time resolution pulse fitting. Marthi and Maan (2025) have measured scintillation bandwidths of ~ 100 Hz at 600 MHz for the magnetar XTE J1810-197, while simultaneously measuring a scatter broadening time of ~ 1.2 ms, using Nyquist-sampled Band-4 baseband data. The adjacent figure shows the measured scintillation bandwidths across Band-4, consistent with its expected quartic dependence on frequency. The simultaneous in-situ measurements of scintillation and scattering enable them to directly measure the turbulence parameter C_1, through the uncertainty relation. While the measured C_1 does not strongly constrain the power law index of the electron density wavenumber spectrum, the large scatter-broadening measurement allows constraining the emission size at the magnetar to ~ 100-1000 km.
Magnetic Field in the Lobes of the Seyfert Galaxy NGC 3516: Suggestions of a Helical Field
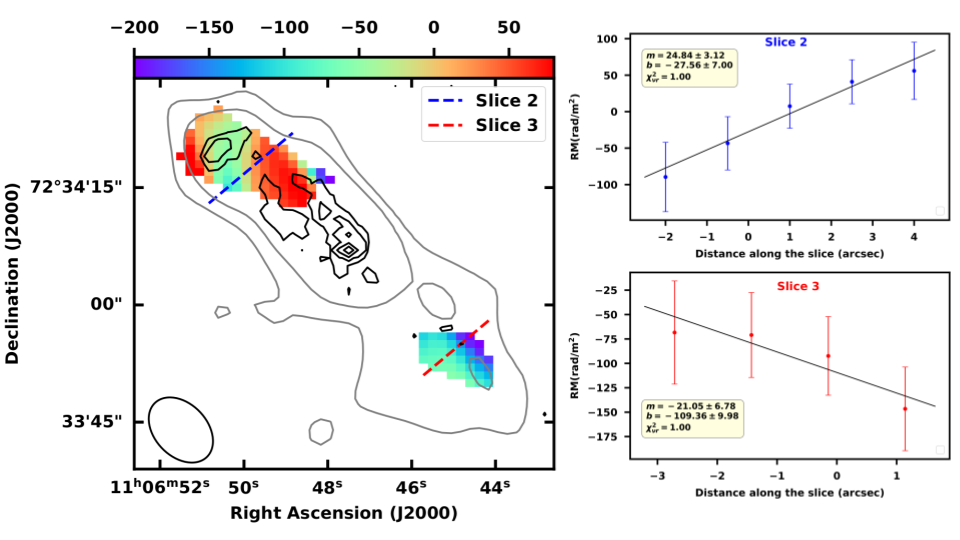
Seyferts are a class of active galactic nuclei (AGNs) found in spiral or lenticular galaxies, characterised by a bright, compact nucleus featuring high-ionisation emission lines in their optical/UV spectra. These AGNs are traditionally thought to lack strong jet outflows and are thus faint in radio synchrotron emission. Ghosh et al. present multi-frequency radio-polarimetric observations of NGC3516, a Seyfert galaxy and changing-look AGN, using the Karl G. Jansky Very Large Array (VLA) at 5.5 and 10 GHz, and the Giant Metrewave Radio Telescope at 663 MHz, and revealing the importance of the magnetic field in shaping even weak radio jets. NGC3516 shows polarised radio continuum emission, indicating the presence of both poloidal and toroidal magnetic fields. For the first time, the authors detected transverse gradients in the rotation measure (RM, the ratio of the difference between the intrinsic and observed polarisation angles to the square of the wavelength) across the kiloparsec-scale lobes in a radio-quiet Seyfert outflow. This indicates an ordered helical magnetic field, sustained out to kiloparsec scales. The RM gradients are oriented in opposite directions in the northern and southern lobes relative to the core, consistent with a helical magnetic field being wound by the same central engine, but viewed on opposite sides. The left panel of the figure shows the RM of NGC3516, along with the transverse slices taken along the northern (blue) and southern (red) lobes; VLA 5.5 GHz (black) and 10 GHz (grey) contours of the source at >3 sigma are overplotted. The right panel shows gradients fitted using the chi-square minimisation technique. Additionally, the authors report the first-ever detection of circular polarisation in both the core and inner jet knot in a Seyfert galaxy, confirming the presence of complex magnetic field configurations in even a radio-quiet system.
An ALMA [CII] 158 micron Survey of Damped Lyman-alpha Absorber Galaxies at z ∼ 4
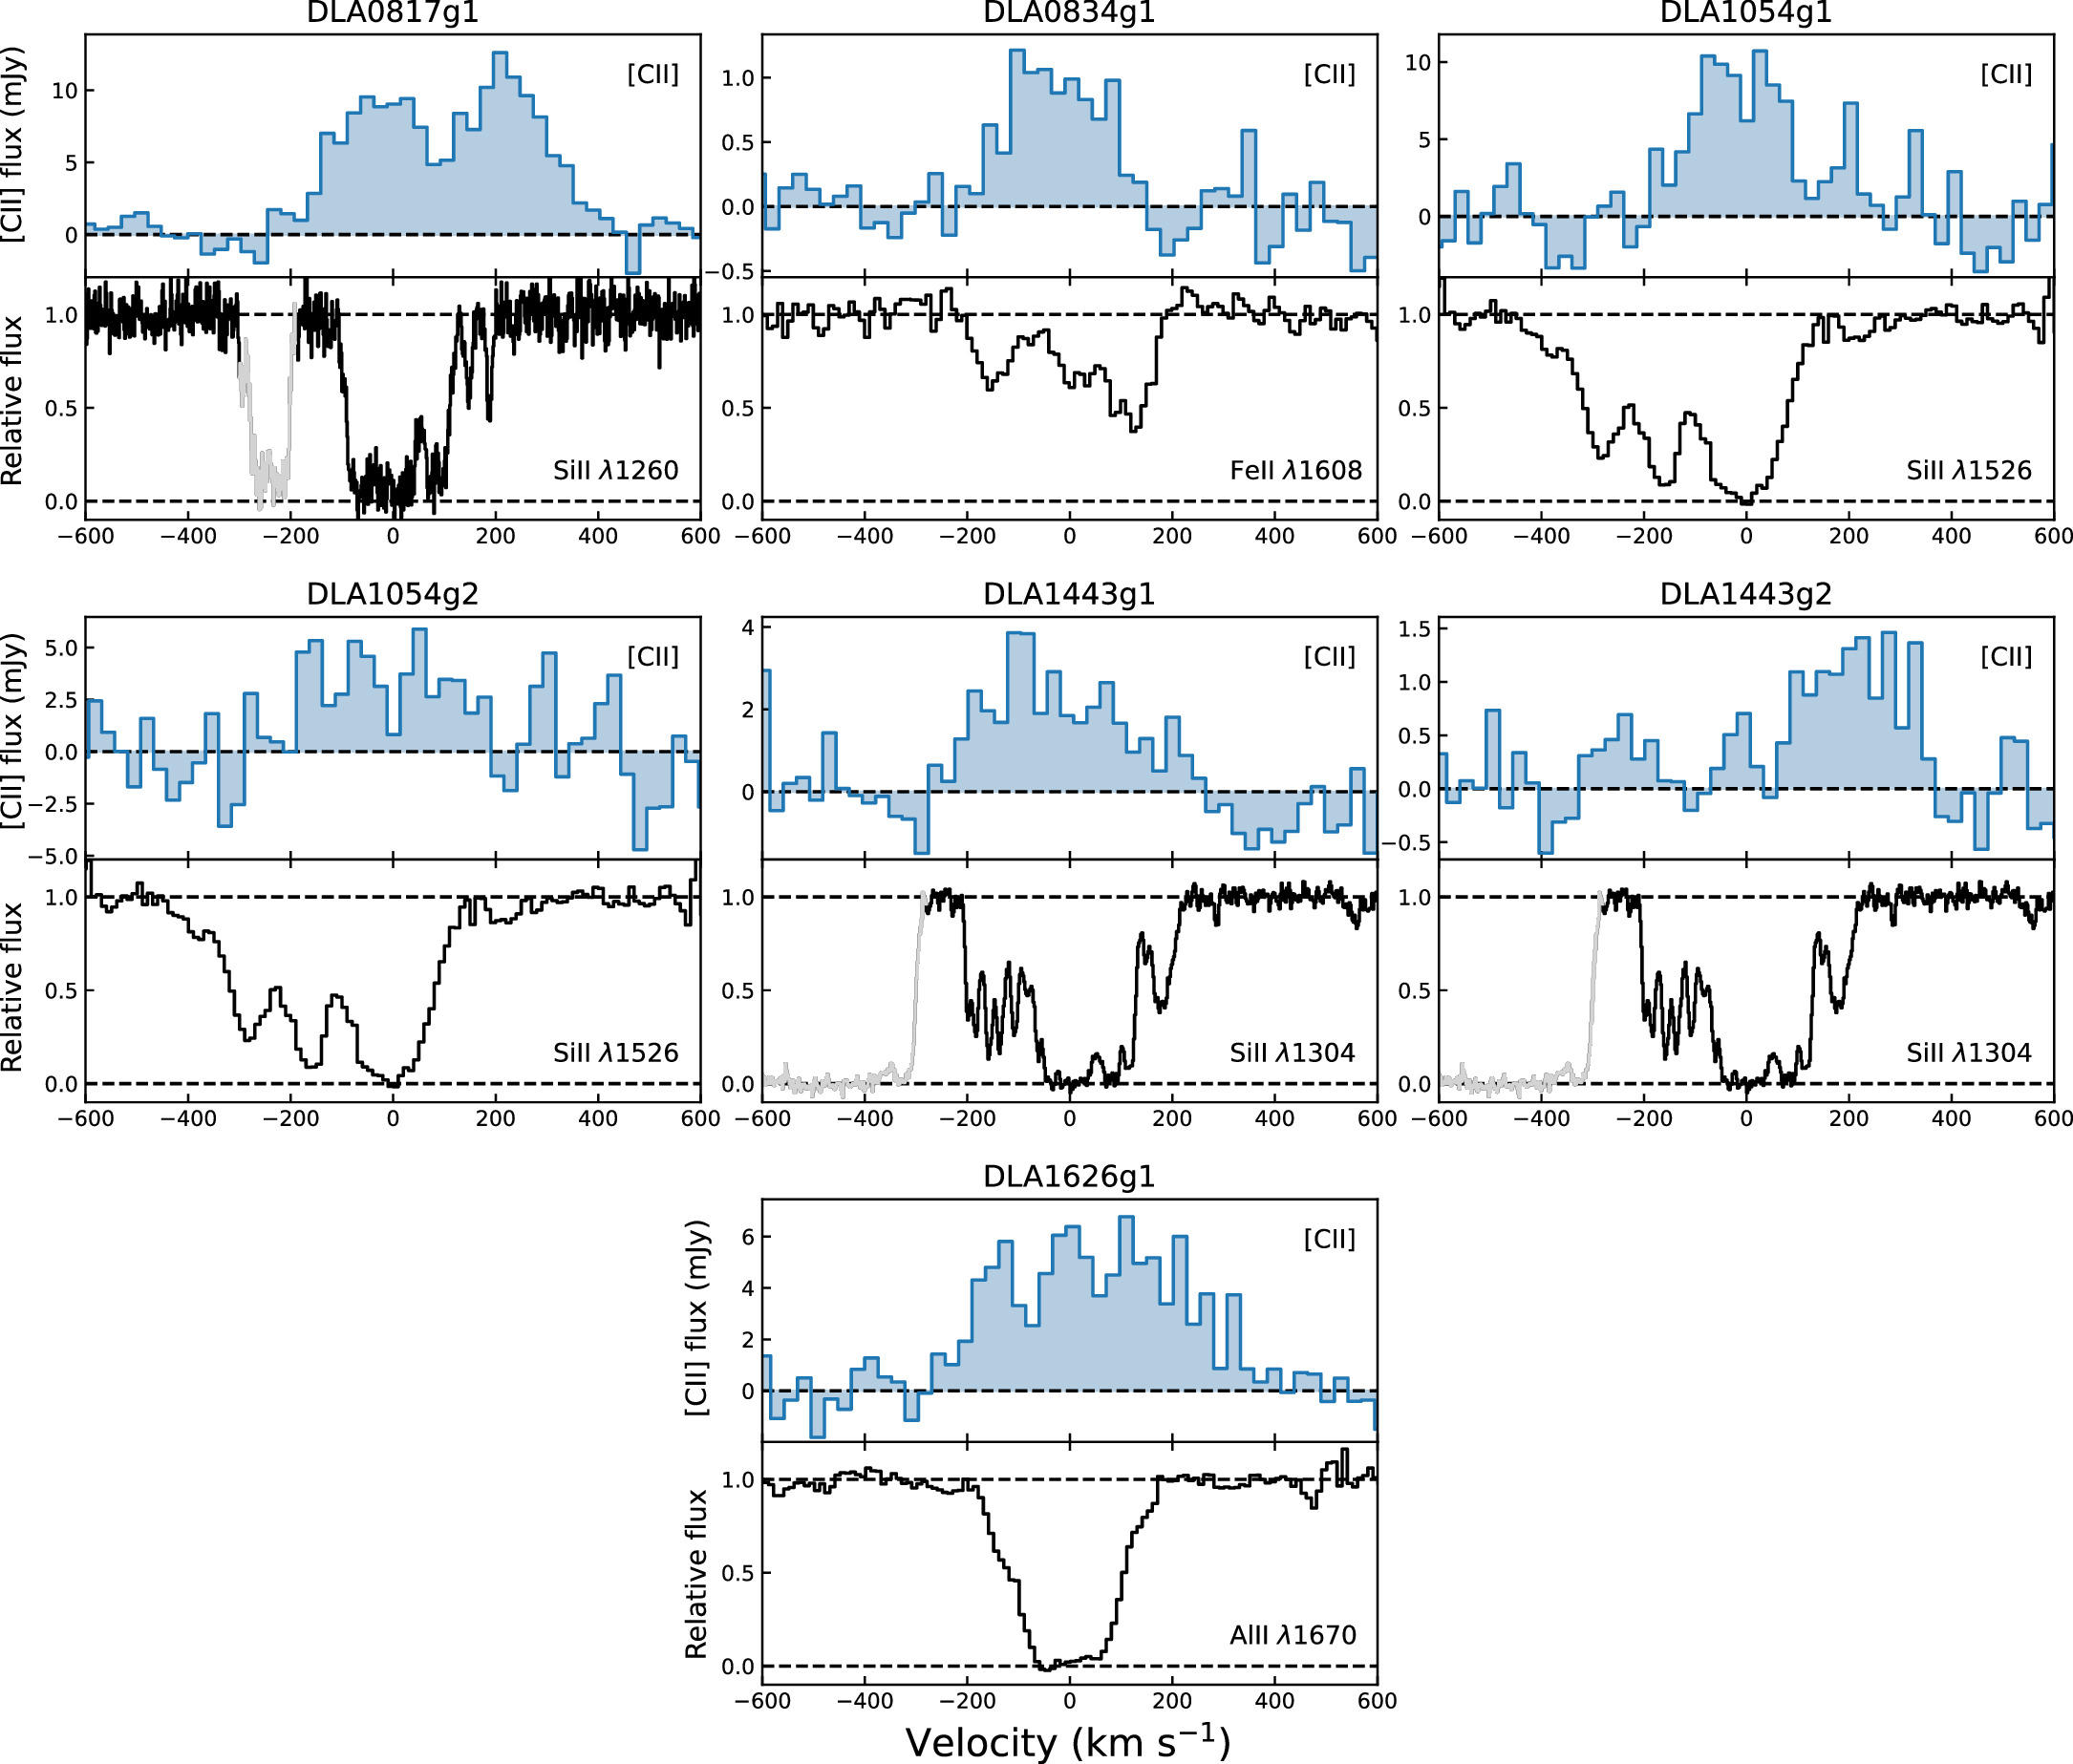
Galaxies selected by their absorption signatures in the spectra of background quasars provide a way of identifying high-redshift galaxy samples unbiased by the galaxy luminosity. However, the nature of such absorption-selected galaxies and their connection to the emission-selected population have long been open questions: the proximity of the bright background quasar has made it difficult to identify and study the foreground faint galaxy. Neeleman et al. present an Atacama Large Millimeter/submillimeter Array (ALMA) survey to study the galaxies associated with a representative sample of 16 damped Lyman-alpha absorbers (DLAs) at z~4.1-4.5, using the [C II] 158-micron ([CII]) line. The authors detect seven [CII]-emitting galaxies in the fields of five DLAs, all of which have absorption metallicity [M/H] > -1.5. They find that the detectability of these HI-absorption-selected galaxies with ALMA is a strong function of DLA metallicity, with a detection rate of ~71% for DLAs with high metallicity, [M/H] > ‑1.5, while no galaxies are identified in the fields of DLAs with [M/H] < ‑1.5. The identified DLA galaxies have far-IR properties similar to those of typical star-forming galaxies at z ∼ 4, with estimated obscured star formation rates ranging from 6 to 110 solar masses per year. High-metallicity DLAs therefore provide an efficient way to identify and study samples of high-redshift, star-forming galaxies, without preselecting the galaxies by their emission properties. The agreement between the velocities of the metal absorption lines of the DLA and the [CII] emission line of the DLA galaxy indicates that the metals within the DLA originated in the galaxy. With observed impact parameters between 14 and 59 kpc, this indicates that star-forming galaxies at z ∼ 4 have a substantial reservoir of dense, cold, neutral gas within their circumgalactic medium that has been enriched with metals from the galaxy. The figure shows a comparison between the ALMA [CII] emission and optical line absorption profiles for the seven galaxies: the absorption and emission velocities are seen to be in remarkable agreement.
A Massive HI-absorption-selected Galaxy at z ~ 2.356
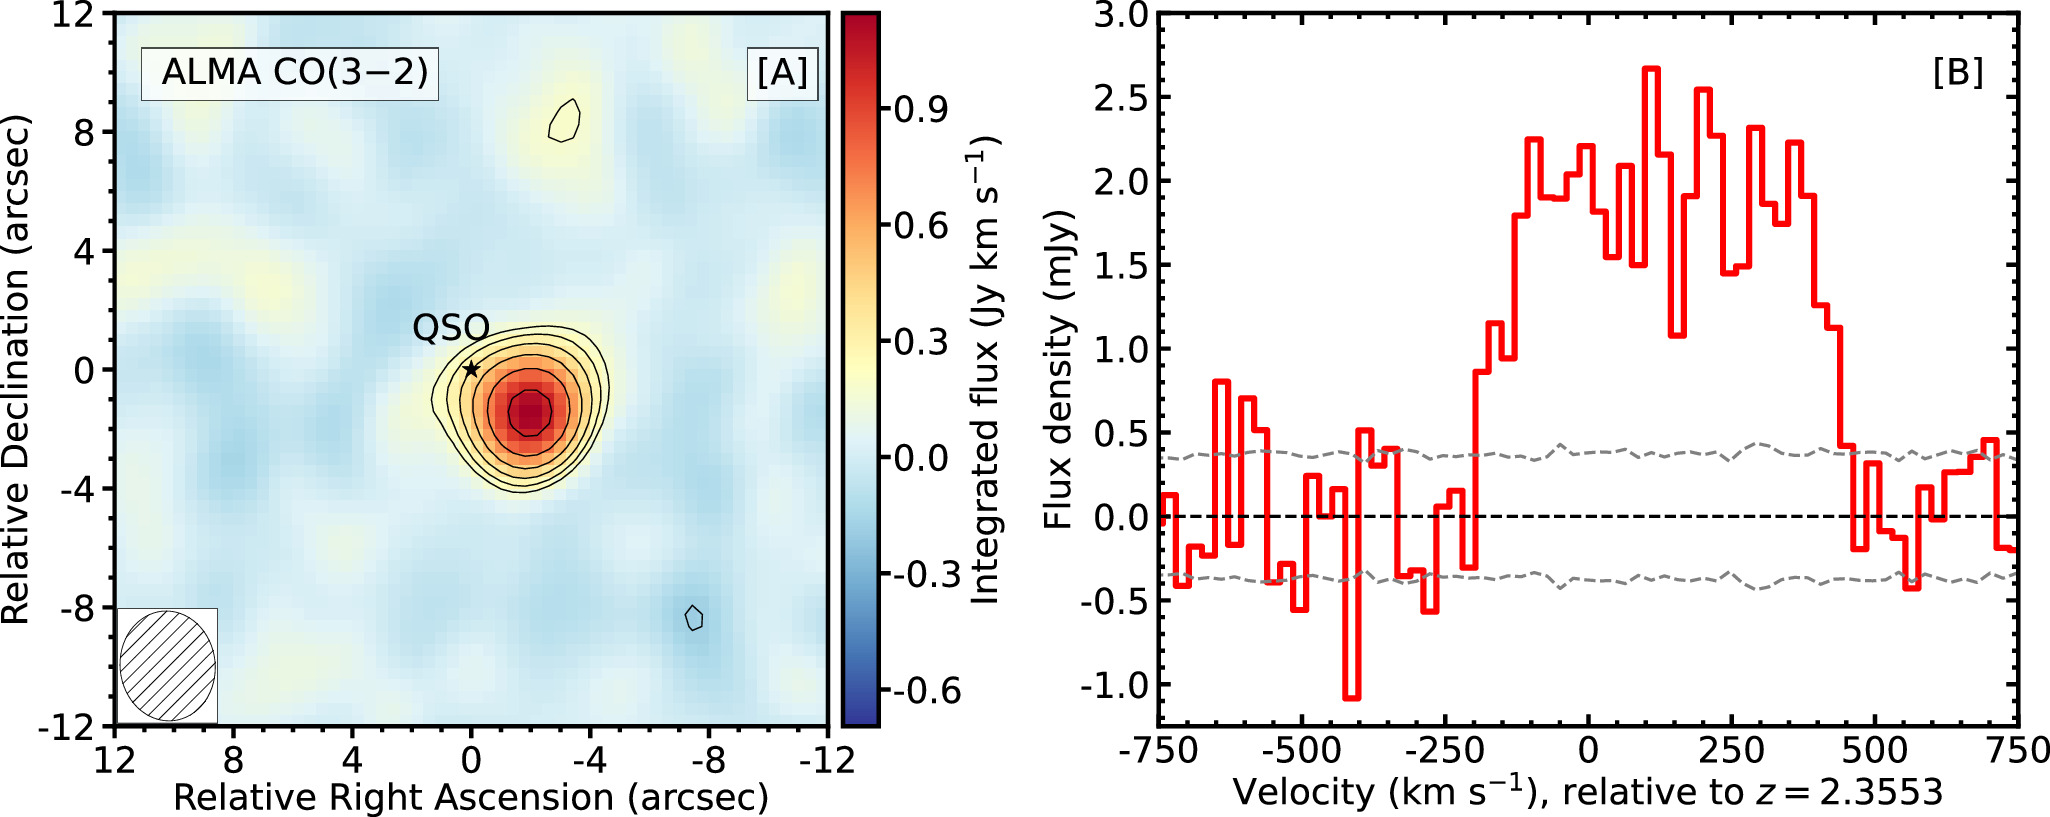
The nature of the absorption-selected galaxies that give rise to high-redshift damped Lyman-alpha absorbers (DLAs) towards background quasars has been an open question in astronomy for nearly four decades, with models for the absorbing galaxies ranging from faint dwarfs to large spiral disk galaxies. Kaur et al. used the Jansky Very Large Array (VLA) and the Atacama Large Millimeter/submillimeter Array (ALMA) to detect CO(1-0), CO(3-2), and rest-frame 349 GHz continuum emission from an absorption-selected galaxy, DLA1020+2733g, at z~2.3568 in the field of the z=2.3553 DLA toward QSO J1020+2733. The VLA CO(1-0) detection yields the highest molecular gas mass ever measured in an absorption-selected galaxy. Kaur et al. obtain a super-solar DLA metallicity from the Zn absorption line detected in a Keck Echellette Spectrograph and Imager spectrum: this continues the trend of high-metallicity DLAs being frequently associated with massive galaxies. The authors obtain a star formation rate (SFR) of <~ 400 solar masses per year from the rest-frame 349 GHz continuum emission and a relatively long molecular gas depletion timescale of >~ 0.6 Gyr. The combination of ALMA and VLA data show that the excitation of the J=3 CO rotational level is subthermal, suggesting that DLA1020+2733g has a low SFR surface density. The large velocity spread of the CO lines, ~500 km/s, and the long molecular gas depletion timescale indicate that DLA1020+2733g is likely to be a massive cold rotating-disk galaxy. The figure shows (left panel) the ALMA CO(3-2) image of DLA1020+2733g and (right panel) the ALMA CO(3-2) spectrum of the galaxy.
A New Polarization Calibration Framework for Low-Frequency Radio Interferometers Using the Unpolarized Sky
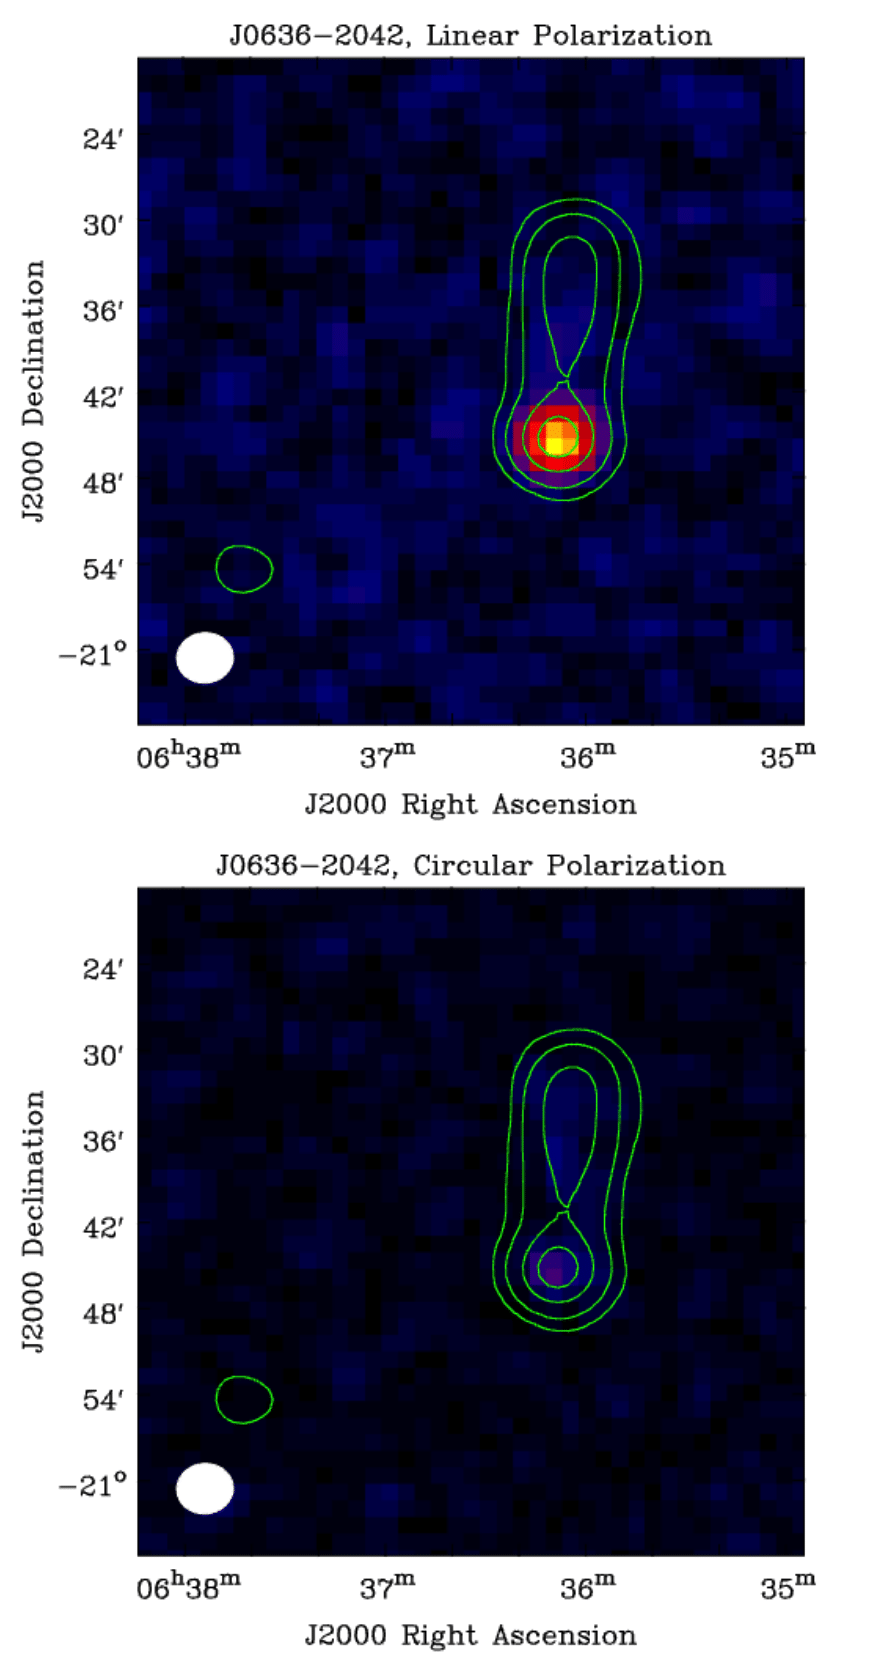
Accurate calibration of polarized radio emission is crucial for investigating magnetic fields in the universe, but remains particularly difficult at meter wavelengths due to the lack of bright polarized calibrators. With the Square Kilometre Array (SKA) set to start operations later this decade, resulting in a leap in sensitivity, there is a pressing need for a robust polarization calibration framework tailored to low-frequency observations. This is essential not only for the SKA-Low but also for its precursors and pathfinders such as the Murchison Widefield Array (MWA), LOFAR, and the upgraded Giant Metrewave Radio Telescope (uGMRT). Kansabanik et al. present a novel polarization calibration method that utilizes the apparent polarization imprinted on the unpolarized sky by the telescope’s polarized primary beam. This approach eliminates the dependence on intrinsically polarized sources. The method was validated using MWA observations of the active galactic nucleus J0636–2042, which exhibits strong linear polarization in the southern hotspot region and negligible circular polarization. The overlaid contours of total intensity on top of the linearly and circularly polarized emission, shown in the top and bottom panels of the adjacent figure, confirm the expected emission characteristics. This technique allows calibration of both direction-independent and direction-dependent instrumental polarization effects and, importantly, is immune to ionospheric Faraday rotation — one of the key challenges for polarimetric calibration at low frequencies. The method enables instrumental leakage removal down to 1% accuracy for the MWA, without relying on the availability of bright polarized sources. Tests on faint polarized sources further confirm the precision and reliability of this approach. Applicable to a broad range of low-frequency interferometers --- including LOFAR, uGMRT, NenuFAR, OVRO-LWA, and SKA-Low --- this framework marks a significant advance in radio polarimetry, paving the way for high-fidelity polarimetric studies across astrophysical and heliospheric environments.
The Second Case of a Major Merger Triggering a Starburst in a Green Pea Galaxy
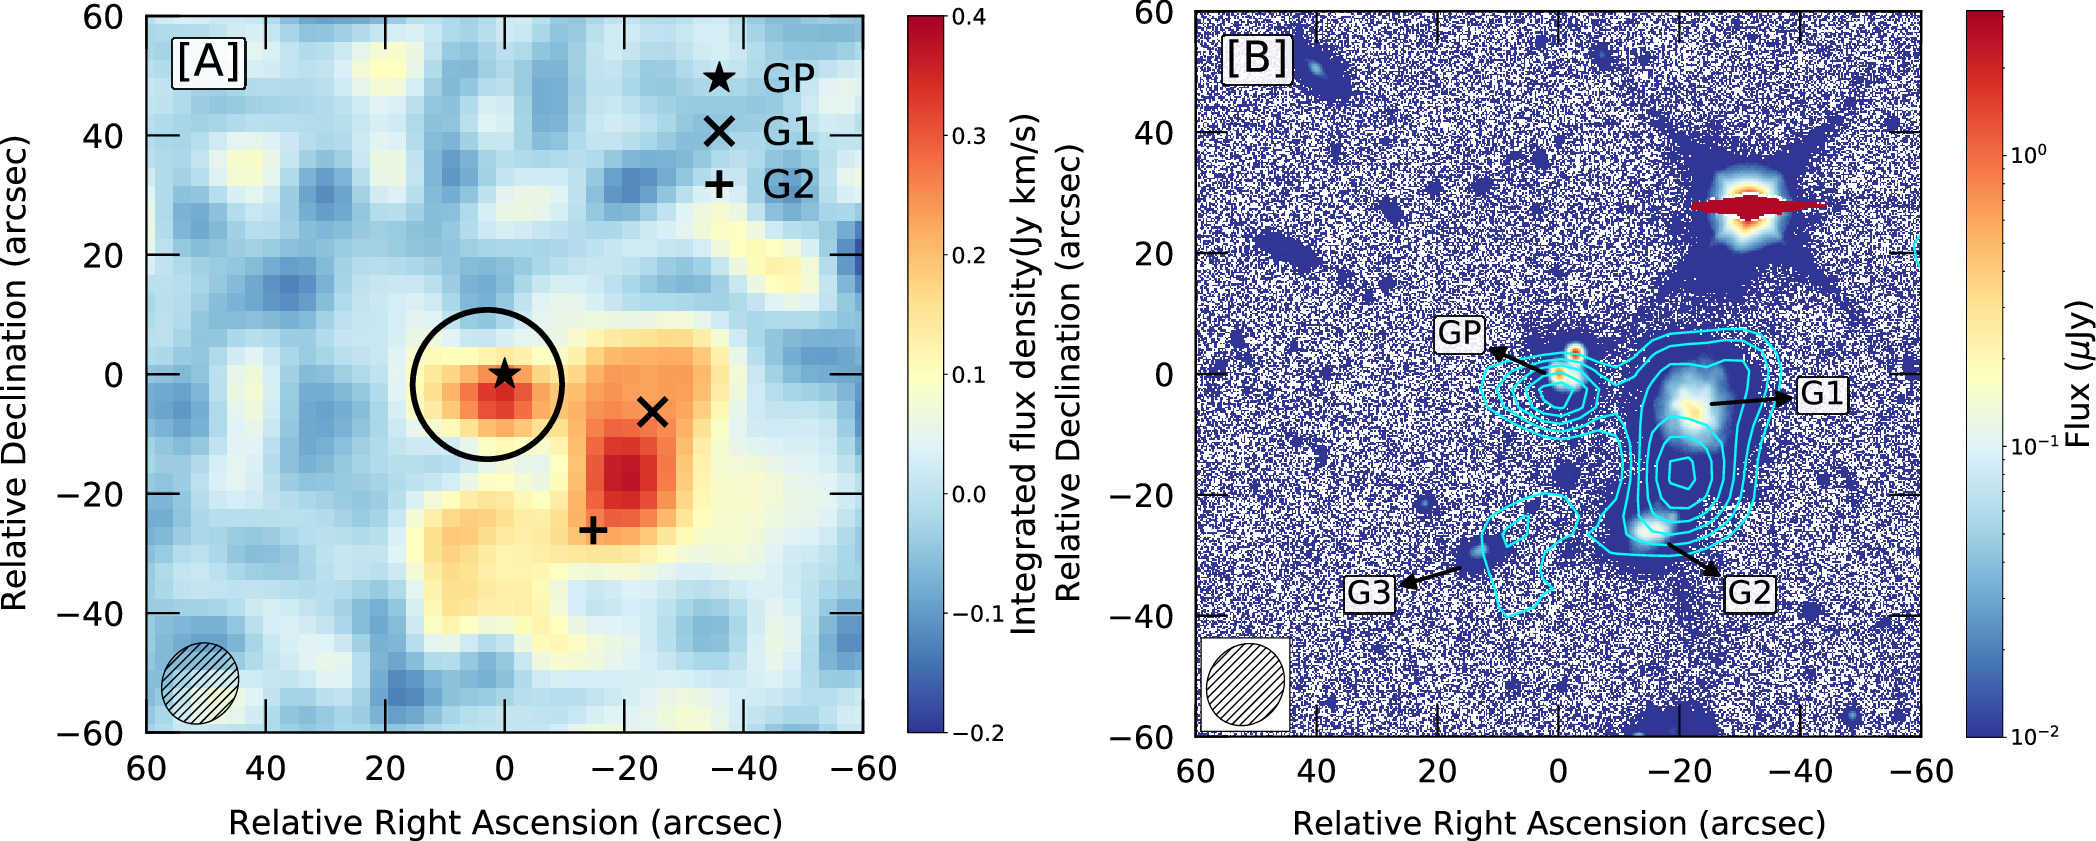
Green Pea galaxies are nearby analogs of the high-redshift dwarf galaxies that are believed to have reionized the Universe around 12 billion years ago. Given that direct observations of the high-redshift dwarfs are difficult due to limitations in both sensitivity and resolution, local analogs like Green Peas with similar properties provide an exciting proxy to understand the processes that led to cosmic reionization. One of the puzzling features of Green Peas is the combination of high star-formation activity and leakage of Lyman-continuum and Lyman-alpha photons. This raises tension between the competing needs for cold neutral gas to fuel the star formation and a sufficiently low atomic hydrogen column density to allow the Lyman-continuum and resonantly scattered Lyman-alpha emission to escape. Mapping the HI distribution is crucial for understanding the physics of Green Peas and the escape of the Lyman-alpha and Lyman-continuum photons. Purkayastha et al. used the Karl G. Jansky Very Large Array (VLA) to map HI 21cm emission from the Green Pea GP J1148+2546 at z~0.0451: this is only the second measurement of the HI spatial distribution of a Green Pea. The VLA HI 21cm image, the DECaLS optical image, and Sloan Digital Sky Survey spectroscopy show that GP J1148+2546 has two close neighbors, and that the HI 21cm emission extends in an inverted \"C\" shape around the Green Pea and its companions, with the highest HI column density between the two neighboring galaxies. The starburst in GP J1148+2546 appears to have been triggered by the ongoing merger with its neighbors, although the velocity field and velocity dispersion images do not show clear merger signatures at the Green Pea location. The HI mass of the Green Pea and its immediate surroundings is much lower than the total HI mass of the system of three interacting galaxies, while the HI depletion timescale of GP J1148+2546 is ~0.7 Gyr, much shorter than that of typical nearby galaxies. Purkayastha et al. also detect damped Lyman-alpha absorption and Lyman-alpha emission from the Green Pea in a Hubble Space Telescope Cosmic Origins Spectrograph spectrum, obtaining a high HI column density and a low Lyman-alpha escape fraction, ~0.8%, suggesting that GP J1148+2546 is not likely to leak significant amounts of Lyman-continuum radiation. The left panel of the figure shows the VLA HI intensity image of the field of GP J1148+2546, at a resolution of 14 x 12 . The locations of the Green Pea and its two companions are indicated by the star, the \"X,\" and the \"+\" symbols, respectively. The right panel shows the VLA HI intensity image (in contours) overlaid on the DECaLS g-band image (in color). Here, the locations of the Green Pea and its companions are indicated by the labels GP, G1, and G2 (and the possible third companion by G3).
New Insights into Type-I Solar Noise Storms from High Angular Resolution Spectroscopic Imaging with the uGMRT
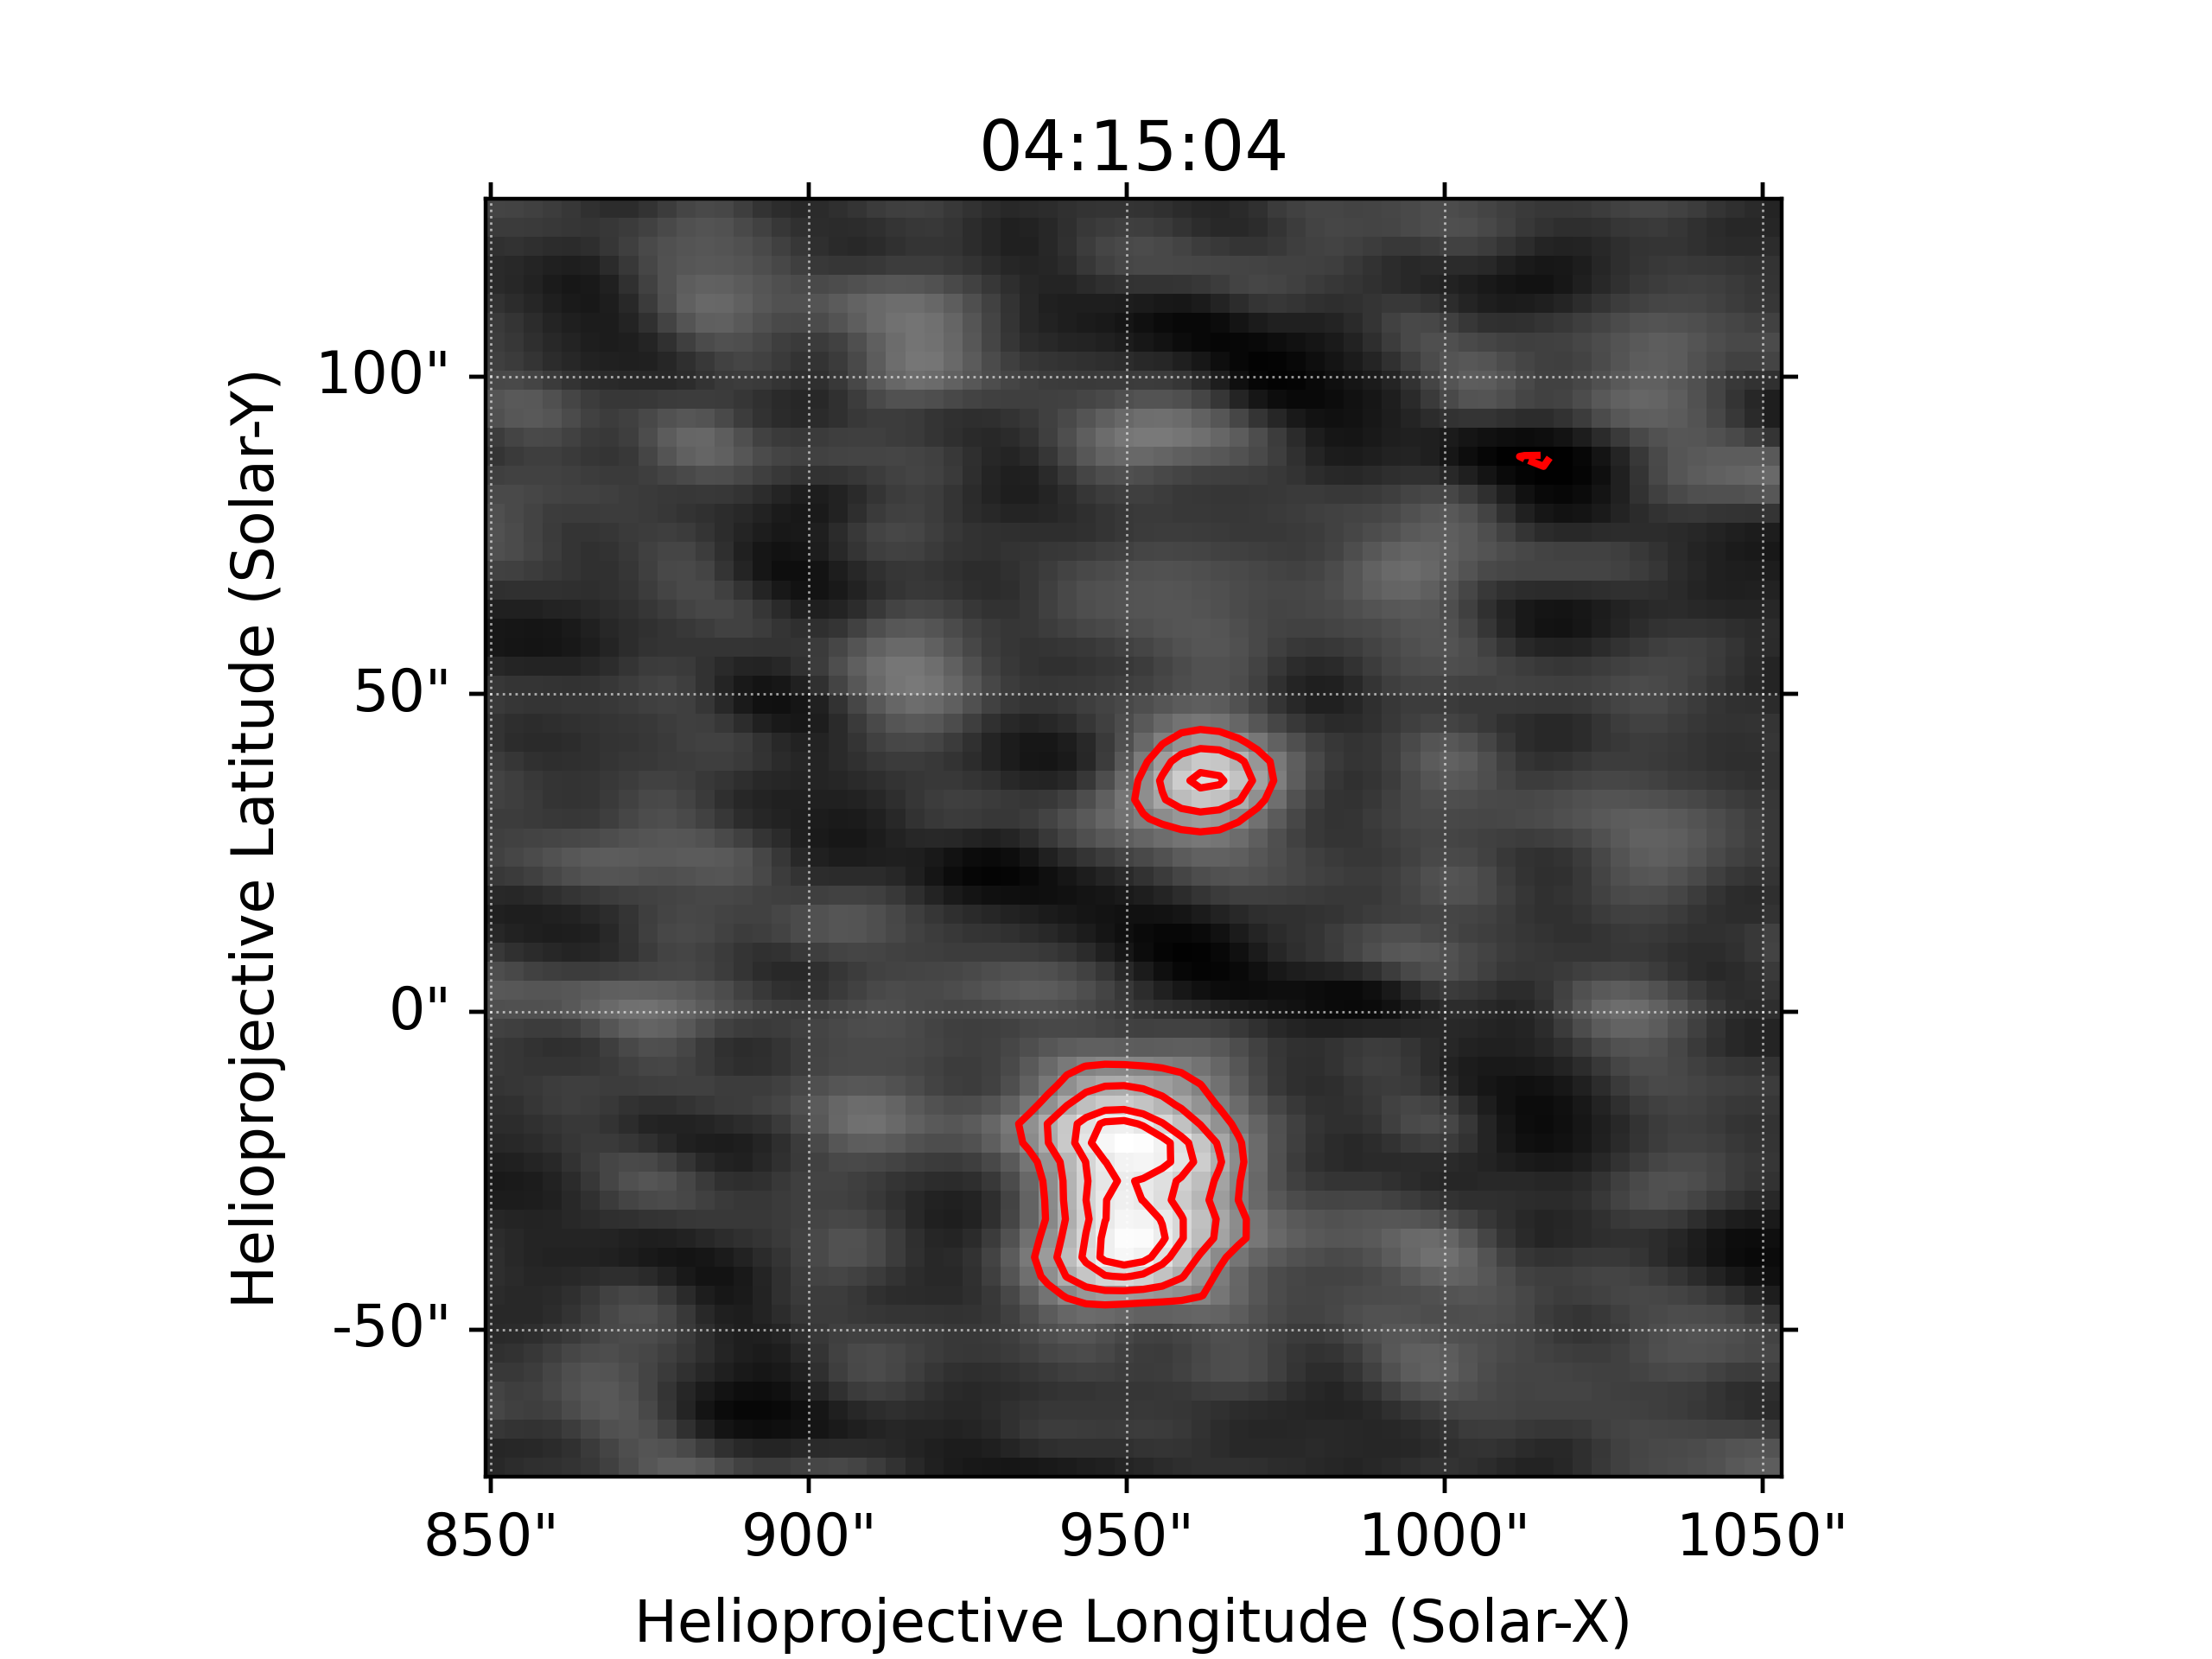
Type-I noise storms are one of the most commonly observed solar radio emissions in the metric and decametric wavelengths. They are characterised by a slowly varying broadband continuum emission, with superposed narrowband impulsive emissions, also known as type-I bursts. While the bandwidth of the type-I continuum is ~100 MHz, type-I bursts typically have bandwidths of a few MHz. Noise storms are generally associated with active regions, and are believed to be produced by the plasma emission mechanism. While solar noise storms have a long history of observations, most of the past investigations have relied on non-imaging dynamic spectra-based studies. While a few imaging observations were reported, they had rather poor angular resolution (~1 arcmin or larger). The usage of low angular resolution data stemmed from the theoretical expectation that scattering due to density inhomogeneities in the solar corona will smoothen out any small angular scale structure and make the apparent observable size much larger. In fact, the estimates for the smallest observable angular size in the solar corona at metric and decametric wavelengths range from approximately 40 arcseconds to a few arcminutes depending on the details of the scattering model and the wavelength of observation. Interestingly this study, using uGMRT observations in the 221-251 MHz band, has been able to detect noise storm sources as small as 9 arcseconds, more than 4 times smaller than the existing predictions and at least three times smaller than previous measurements. In the adjacent figure, the northern source represents the smallest source detected to date at these frequencies and has an angular scale smaller than 9 arcseconds. This surprising discovery suggests the presence of some missing physics in the emission or propagation conditions of the type-I noise storms. This study also used these high angular resolution observations to determine the relationship between type-I continuum emission and type-I bursts. These observations suggest that type-I bursts are produced by travelling disturbances, produced from the same source as powering the noise storm continuum. These travelling disturbances induce magnetic reconnection and subsequent nonthermal electron generation at different heights. Since these electrons have low energies, they get thermalized very quickly, leading to their narrow observed bandwidths. The temporal correlations in changes of morphology observed across widely separated frequencies suggest that while each of the individual type-I bursts is narrowband, they are induced by the same travelling disturbance.
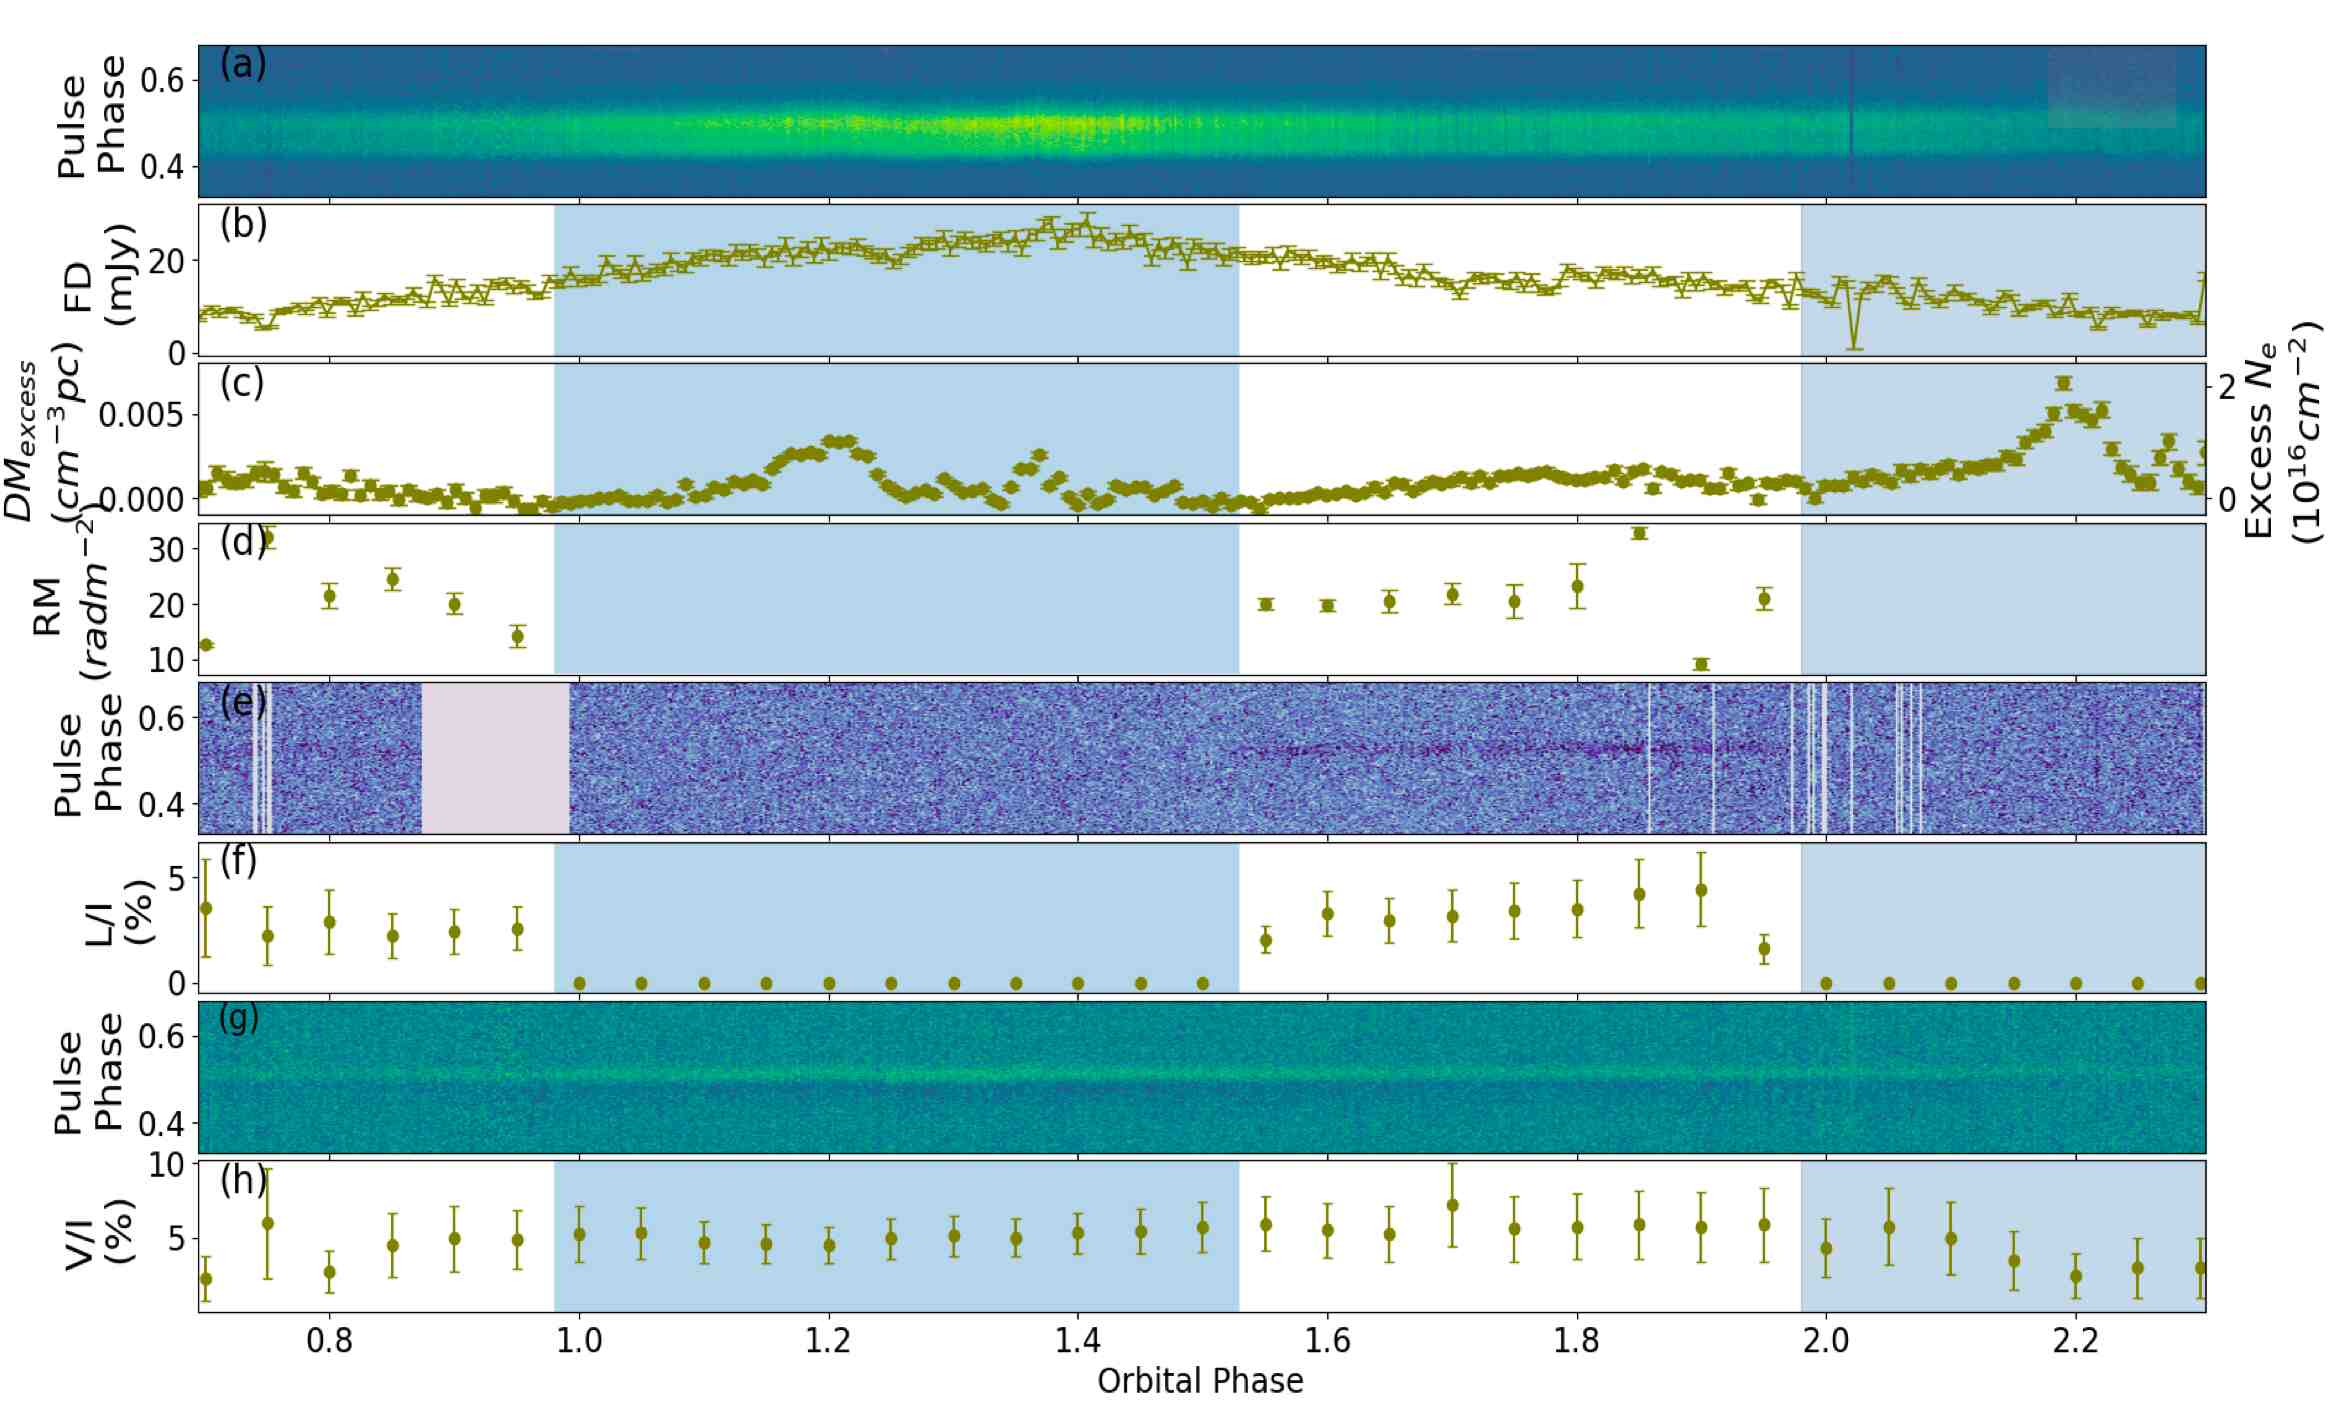
Unveiling frequency-dependent eclipsing in spider millisecond pulsars using broadband polarization observations with the Parkes Telescope
Spiders are millisecond pulsars (MSPs) found in compact binary systems. These systems have orbital periods of less than a day and feature low-mass companions. The spider pulsar s energetic winds ablate the companion, resulting in frequency-dependent eclipses. These eclipses are more pronounced at lower frequencies and have a cut-off frequency above which eclipses do not occur. Orbital phase-resolved studies have so far been conducted for very few spider MSPs. Using publicly available data from the Parkes Ultra-Wideband Receiver (734-4034 MHz), the authors conducted orbital phase-resolved studies for three black widow MSPs. They aimed to investigate the flux density, dispersion measure, and both linear and circular polarizations during the eclipse phase to enhance our understanding of the eclipse medium. The authors estimated the eclipse cut-off frequency for the spider MSP J1431-4715 to be 1251 +/- 80 MHz, leading them to conclude that synchrotron absorption is the primary eclipse mechanism for this system. For PSR J0024-7204J, they found that the eclipse medium is variable, with the cut-off frequency changing over six epochs of observations. Similar behaviour has been earlier reported by Kumari et al. (2024) for PSR J1544+4937. However, for PSR J1959+2048, the authors found a cut-off frequency greater than 1400 MHz consistently for all the epochs. For all three systems, the authors observed that the linear polarization fraction dropped to zero during the eclipse phase, a behavior that has been noted for other black widow MSPs in earlier studies. Additionally, they detected a fourfold increase in the flux density for PSR J0024-7204J during the eclipse phase compared to the non-eclipse phase, which could represent the first detection of plasma lensing in this system. With this study, the authors have doubled the sample size of spider MSPs with orbital phase-resolved studies, providing deeper insights into the eclipse environment. In the figure, the eight panels, from top to bottom, depict the variation of (a) total intensity, (b) flux density (FD) of total intensity, (c) excess DM (DM_excess) along the line of sight, (d) RM, (e) linear polarization intensity, (f) linear polarization percentage, (g) circular polarization intensity, and (h) circular polarization percentage with orbital phase for PSR J0024−7204J on 2019 July 8. These quantities were calculated for the 704−1107 MHz frequency range. The blue-shaded eclipse regions are based on the depolarization width. Depolarization and flux magnification are noted in the eclipse phase.